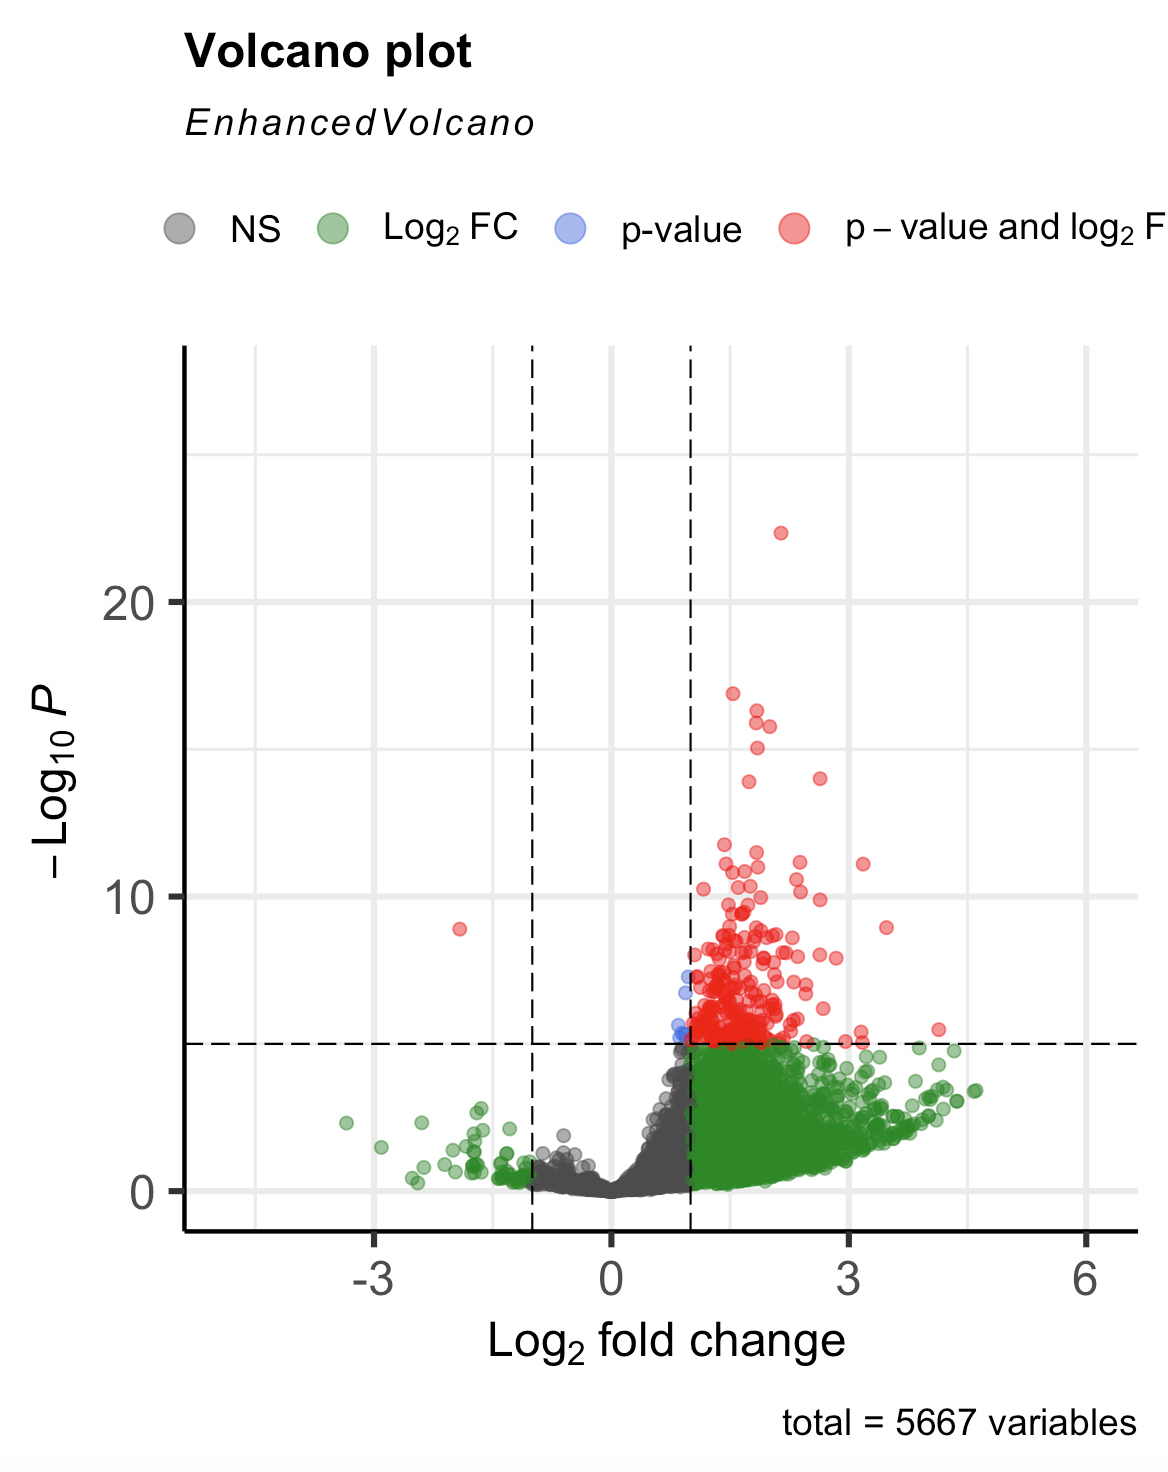
I am playing around with some test data and thought to add a third condition (let's just say A & B are treatments, C is the control) to try getting pairwise comparisons but am stuck on two questions. 1) how do I get a lfcshrink for my third condition (i.e. A vs B) and 2) why does -log10p value vs log2 FC plot become flipped even though the reference is still C?
Additional info: I followed the instructions here on multiple comparisons (https://github.com/tavareshugo/tutorial_DESeq2_contrasts/blob/main/DESeq2_contrasts.md) and I duplicated and renamed A to make dataset B. So A vs C and B vs C should be the same while A vs B is 0.
Here is my code
dds <- DESeqDataSetFromMatrix(countData = my_cts,
                          colData = my_coldata,
                          design = ~ condition)
dds

#prefilter row sums with less than 10 reads
keep <- rowSums(counts(dds)) >= 10
dds <- dds[keep,]


#factor levels
dds$condition <- relevel(dds$condition, ref = "C") #isn't this how I set the control?

#do i need these?
    #dds <- estimateDispersions(dds)
    #dds <- nbinomWaldTest(dds)

#deseq
dds <- DESeq(dds)

#check coefficients estimated by DEseq
resultsNames(dds)

#obtain results
res1_aa_ctrl <- results(dds, contrast = c("condition_A_vs_C")) #still backwards
res1_bb_ctrl <- results(dds, contrast = list("condition_B_vs_C"))
res1_aa_bb <- results(dds, contrast = list("condition_A_vs_C",
                                                 "condition_B_vs_C"))

# define the model matrix
mod_mat <- model.matrix(design(dds), colData(dds))
mod_mat

# calculate coefficient vectors for each group
ctrl <- colMeans(mod_mat[dds$condition == "C", ])
aa <- colMeans(mod_mat[dds$condition == "A", ])
bb <- colMeans(mod_mat[dds$condition == "B", ])

#obtain results for each pairwise contrast
res2_aa_ctrl <- results(dds, contrast = ctrl - aa) #order can affect distribution (I reversed these to get the "correct" distribution but originally it was written the other way to show that res2 gets the same result as res1.
res2_bb_ctrl <- results(dds, contrast = ctrl - bb)
res2_aa_bb <- results(dds, contrast = aa - bb)

# plot the results from the two approaches to check that they are identical (therefore you could use any of the appraches)
plot(res1_aa_ctrl$log2FoldChange, res2_aa_ctrl$log2FoldChange)

#shrink results for better viewing
resLFC <- lfcShrink(dds, coef = "condition_A_vs_C", type = "apeglm")
Afterwards, I plot my graphs:
#volcano plot
data <- res1_aa_ctrl
library(EnhancedVolcano)
EnhancedVolcano(data,
    lab = rownames(data),
    x = 'log2FoldChange',
    y = 'pvalue')
gives me
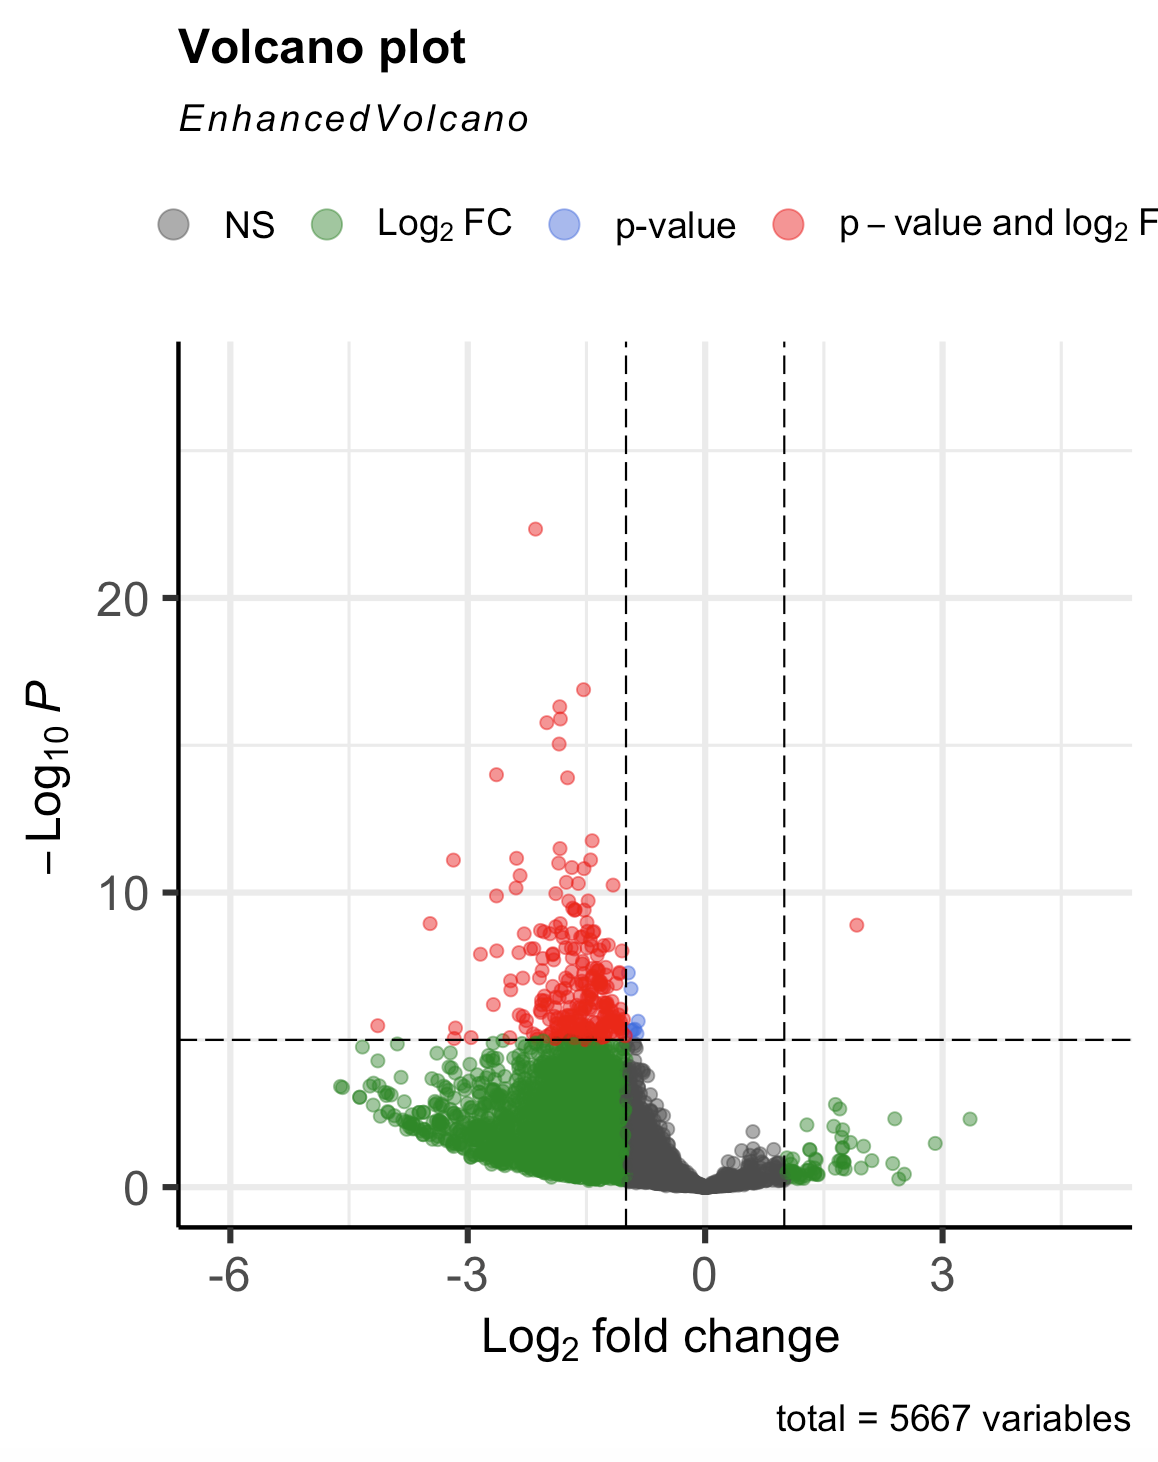
but what I expected/wanted was this (which I got yesterday without having to use this method and with only A and C datasets)
Also when should I relevel the dataset to find A vs B? I tried using this code but it didn't work (cant set dds to another variable name for some reason)
dds2 <- dds
relevel(dds$condition, ref="B")
dds <- nbinomWaldTest(dds)
resultsNames(dds)
lfcShrink(dds = dds2, coef = 3, type = "apeglm")


If it helps clarify, my numerator should be A and denominator should be C. A is significantly downregulated compared to C, but for some reason I am seeing the opposite. Am I flipping the conditions somewhere in my code? I triple checked that I am loading the samples and controls correctly, so it's not that.