I am trying to plot differentially methylated regions using DMR.plot, but running into the error message: "Error in .local(GdObject, ...) : Too many stacks to draw. Either increase the device size or limit the drawing to a smaller region."
I think the issue may be related to the number of samples I have that I am trying to compare DMRs across (306 samples), whereby I think I am running into vertical spacing limits for the plot, but I am not sure how best to subset my data to get it to show all samples, or how to show a random subset of samples for descriptive purposes. Any advice is greatly appreciated!!
My code is as follows:
DMR Analysis
PM5yrSamp_dich <- factor(targetsx$PM5yrSamp_dich)
Make a design matrix
design <- model.matrix(~0+PM5yrSamp_dich, data=targetsx)
Make contrasts
contMatrix <- makeContrasts(PM5yrSamp_dich = PM5yrSamp_dichLow - PM5yrSamp_dichHigh,
                            levels=design)
contMatrix
myAnnotation <- cpg.annotate(object = mVals, datatype = "array", what = "M",
                             analysis.type = "differential", design = design,
                             contrasts = TRUE, cont.matrix = contMatrix,
                             coef = "PM5yrSamp_dich", arraytype = "EPIC")
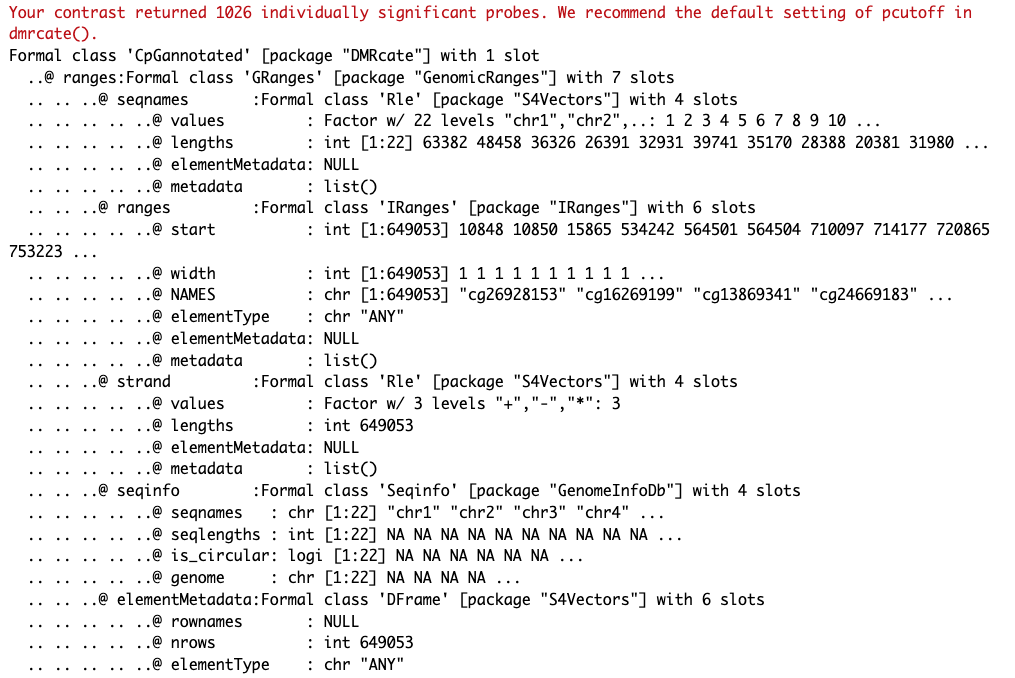
str(myAnnotation)

DMRs <- dmrcate(myAnnotation, lambda=1000, C=2)
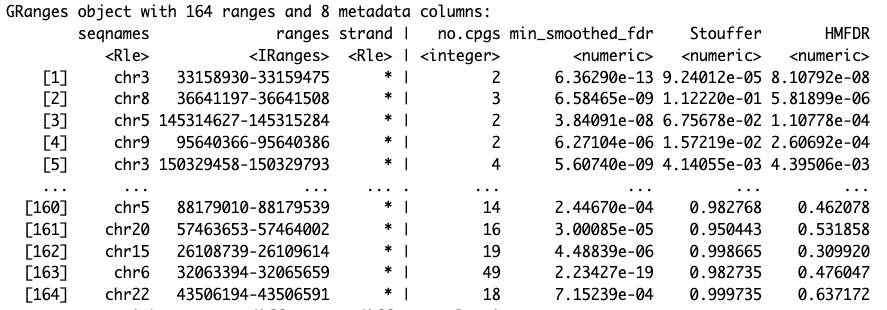
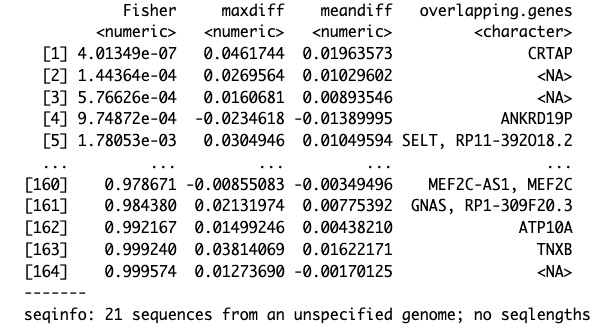
results.ranges <- extractRanges(DMRs)
results.ranges

Visualize the DMRs
# set up the grouping variables and colours
groups <- pal[1:length(unique(targetsx$PM5yrSamp_dich))]
names(groups) <- levels(factor(targetsx$PM5yrSamp_dich))
cols <- groups[as.character(factor(targetsx$PM5yrSamp_dich))]
par(mfrow=c(1,1))
#Issue with this plot, I think because we are trying to visualize too many samples?
DMR.plot(ranges = results.ranges, dmr = 1, CpGs = bVals, phen.col = cols,
         what = "Beta", arraytype = "EPIC", genome = "hg19")
Session details below:
sessionInfo( )
R version 4.2.0 (2022-04-22) Platform: x86_64-pc-linux-gnu (64-bit) Running under: Red Hat Enterprise Linux
Matrix products: default BLAS: /usr/lib64/libblas.so.3.4.2 LAPACK: /usr/lib64/liblapack.so.3.4.2
locale:
1 LC_CTYPE=en_US.UTF-8 LC_NUMERIC=C LC_TIME=en_US.UTF-8 LC_COLLATE=en_US.UTF-8
5 LC_MONETARY=en_US.UTF-8 LC_MESSAGES=en_US.UTF-8 LC_PAPER=en_US.UTF-8 LC_NAME=C
[9] LC_ADDRESS=C LC_TELEPHONE=C LC_MEASUREMENT=en_US.UTF-8 LC_IDENTIFICATION=C
attached base packages: 1 grid stats4 parallel stats graphics grDevices utils datasets methods base
other attached packages:
1 DMRcatedata_2.14.0 writexl_1.4.0
3 DMRcate_2.10.0 Gviz_1.40.0
5 minfiData_0.42.0 IlluminaHumanMethylation450kmanifest_0.4.0
[7] missMethyl_1.30.0 IlluminaHumanMethylationEPICanno.ilm10b4.hg19_0.6.0
[9] IlluminaHumanMethylation450kanno.ilmn12.hg19_0.6.1 RColorBrewer_1.1-3
[11] IlluminaHumanMethylationEPICmanifest_0.3.0 IlluminaHumanMethylationEPICanno.ilm10b2.hg19_0.6.0
[13] minfi_1.42.0 bumphunter_1.38.0
[15] locfit_1.5-9.5 iterators_1.0.14
[17] foreach_1.5.2 Biostrings_2.64.0
[19] XVector_0.36.0 limma_3.52.4
[21] knitr_1.39 SummarizedExperiment_1.26.1
[23] Biobase_2.56.0 GenomicRanges_1.48.0
[25] GenomeInfoDb_1.32.2 IRanges_2.30.1
[27] S4Vectors_0.34.0 MatrixGenerics_1.8.0
[29] matrixStats_0.63.0 here_1.0.1
[31] sesame_1.14.0 sesameData_1.14.0
[33] ExperimentHub_2.4.0 AnnotationHub_3.4.0
[35] BiocFileCache_2.4.0 dbplyr_2.2.1
[37] BiocGenerics_0.42.0 readxl_1.4.0
[39] forcats_0.5.1 stringr_1.4.1
[41] dplyr_1.0.10 purrr_0.3.5
[43] readr_2.1.2 tidyr_1.2.1
[45] tibble_3.1.8 ggplot2_3.3.6
[47] tidyverse_1.3.2
loaded via a namespace (and not attached):
1 rappdirs_0.3.3 rtracklayer_1.56.0 R.methodsS3_1.8.2
4 bit64_4.0.5 DelayedArray_0.22.0 R.utils_2.12.1
[7] data.table_1.14.6 rpart_4.1.16 KEGGREST_1.36.0
[10] RCurl_1.98-1.8 GEOquery_2.64.0 AnnotationFilter_1.20.0
[13] generics_0.1.3 GenomicFeatures_1.48.0 preprocessCore_1.58.0
[16] RSQLite_2.2.20 bit_4.0.5 tzdb_0.3.0
[19] xml2_1.3.3 lubridate_1.8.0 httpuv_1.6.6
[22] assertthat_0.2.1 gargle_1.2.0 xfun_0.31
[25] hms_1.1.1 evaluate_0.15 promises_1.2.0.1
[28] fansi_1.0.3 restfulr_0.0.13 scrime_1.3.5
[31] progress_1.2.2 DBI_1.1.3 htmlwidgets_1.5.4
[34] reshape_0.8.9 googledrive_2.0.0 ellipsis_0.3.2
[37] backports_1.4.1 permute_0.9-7 annotate_1.74.0
[40] biomaRt_2.52.0 deldir_1.0-6 sparseMatrixStats_1.8.0
[43] vctrs_0.4.1 ensembldb_2.20.1 cachem_1.0.6
[46] withr_2.5.0 BSgenome_1.64.0 checkmate_2.1.0
[49] GenomicAlignments_1.32.0 prettyunits_1.1.1 mclust_5.4.9
[52] cluster_2.1.3 lazyeval_0.2.2 crayon_1.5.2
[55] genefilter_1.78.0 edgeR_3.38.0 pkgconfig_2.0.3
[58] nlme_3.1-157 ProtGenerics_1.28.0 nnet_7.3-17
[61] rlang_1.0.4 lifecycle_1.0.1 filelock_1.0.2
[64] modelr_0.1.8 dichromat_2.0-0.1 cellranger_1.1.0
[67] rprojroot_2.0.3 rngtools_1.5.2 base64_2.0
[70] Matrix_1.5-3 Rhdf5lib_1.18.0 reprex_2.0.1
[73] base64enc_0.1-3 googlesheets4_1.0.0 png_0.1-7
[76] rjson_0.2.21 bitops_1.0-7 R.oo_1.25.0
[79] rhdf5filters_1.8.0 blob_1.2.3 DelayedMatrixStats_1.18.0
[82] doRNG_1.8.2 nor1mix_1.3-0 jpeg_0.1-9
[85] scales_1.2.1 memoise_2.0.1 magrittr_2.0.3
[88] plyr_1.8.8 zlibbioc_1.42.0 compiler_4.2.0
[91] BiocIO_1.6.0 illuminaio_0.38.0 DSS_2.44.0
[94] Rsamtools_2.12.0 cli_3.4.1 htmlTable_2.4.1
[97] Formula_1.2-4 MASS_7.3-57 tidyselect_1.2.0
[100] stringi_1.7.8 yaml_2.3.6 askpass_1.1
[103] latticeExtra_0.6-30 VariantAnnotation_1.42.0 tools_4.2.0
[106] rstudioapi_0.13 foreign_0.8-82 bsseq_1.32.0
[109] gridExtra_2.3 digest_0.6.30 BiocManager_1.30.18
[112] shiny_1.7.3 wheatmap_0.2.0 quadprog_1.5-8
[115] Rcpp_1.0.9 siggenes_1.70.0 broom_1.0.0
[118] BiocVersion_3.15.2 later_1.3.0 org.Hs.eg.db_3.15.0
[121] httr_1.4.4 AnnotationDbi_1.58.0 biovizBase_1.44.0
[124] colorspace_2.0-3 rvest_1.0.2 XML_3.99-0.9
[127] fs_1.5.2 splines_4.2.0 statmod_1.4.36
[130] multtest_2.52.0 xtable_1.8-4 jsonlite_1.8.3
[133] R6_2.5.1 Hmisc_4.7-0 pillar_1.8.1
[136] htmltools_0.5.3 mime_0.12 glue_1.6.2
[139] fastmap_1.1.0 BiocParallel_1.30.3 interactiveDisplayBase_1.34.0
[142] beanplot_1.3.1 codetools_0.2-18 utf8_1.2.2
[145] lattice_0.20-45 curl_4.3.3 gtools_3.9.4
[148] openssl_2.0.4 interp_1.1-3 survival_3.3-1
[151] rmarkdown_2.14 munsell_0.5.0 rhdf5_2.40.0
[154] GenomeInfoDbData_1.2.8 HDF5Array_1.24.0 haven_2.5.0
[157] reshape2_1.4.4 gtable_0.3.1


