Hi, I have MSe data acquired in profile (continuum) mode with a Waters Xevo G2 XS QToF instrument, converted to mzML with MSConvert from proteowizard, and imported using the readMSData(x, centroided = FALSE) function.
I then centroid the data with the pickPeaks function, after smooth and mz-refinement (see code below). My peaks are about 5-10 s wide, and I set the halfWindowSize in smooth() to 2. When trying to save a mzML file (I need this file for other downstream analyses) with writeMSdata I get the error that the halfWindowSize is too big.
data_centroid <- data_profile %>%
  smooth(method = "SavitzkyGolay", halfWindowSize = 2L) %>%
  pickPeaks(refineMZ = "descendPeak", signalPercentage = 30, msLevel = 1L, SNR = 3, method = "MAD") %>%
  filterMsLevel(msLevel=1)

 writeMSData(data_centroid, "MSe_RCentroid.mzML", outformat = "mzml")

#Output:
Error: BiocParallel errors
1 remote errors, element index: 1
0 unevaluated and other errors
first remote error:
Error: fun(object@intensity, halfWindowSize = halfWindowSize, ...) : ‘halfWindowSize’ is too large!
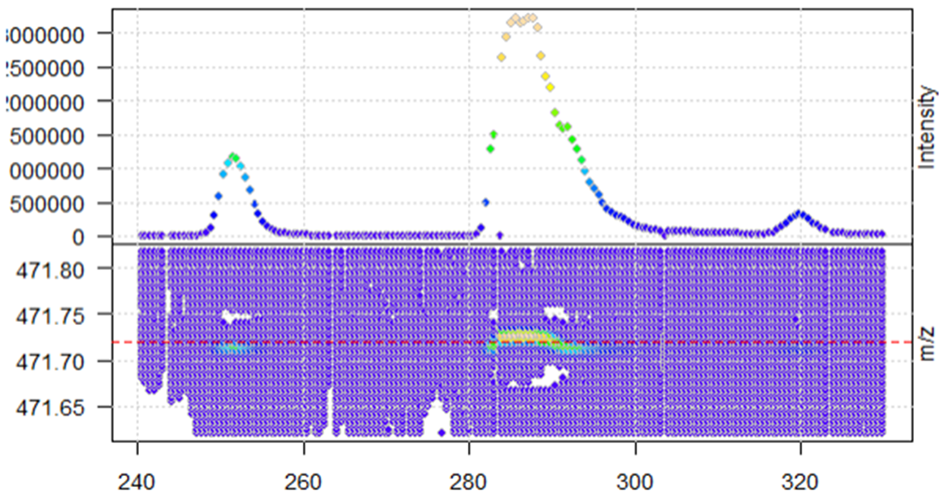
When I extract a specific ion, I see that the profile data has many data points per peak.
mz_M4 <- 471.72
mzr <- c(mz_M4 - 0.1, mz_M4 + 0.1)
rtr <- c(240,330)

        M4 <- data_profile %>%
          filterRt(rtr) %>%
          filterMz(mzr)
        plot(M4, type = "XIC")
        abline(h = mz_M4, col = "red", lty = 2)
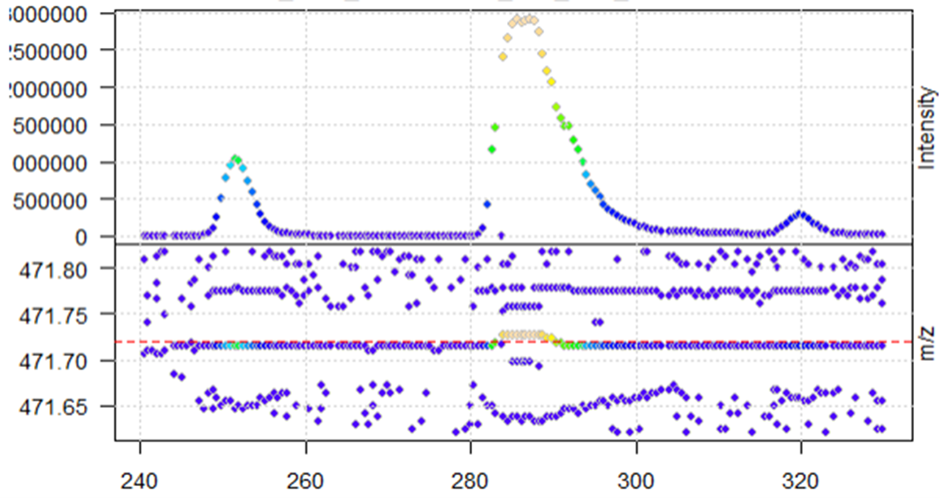
After centroiding with the pickPeaks function above, the function seems to work when looking at the same XIC in the new centroided data (reduction of noise)
M4_cent <- data_centroid %>%
          filterRt(rtr) %>%
          filterMz(mzr)
        plot(M4_cent, type = "XIC")
        abline(h = mz_M4, col = "red", lty = 2)
When plotting, I get the warning message that negative intensities were generated
Warning: No data points between 471.62 and 471.82 for spectrum with acquisition number 901. Returning empty spectrum.Warning: No data points between 471.62 and 471.82 for spectrum with acquisition number 976. Returning empty spectrum.Warning: No data points between 471.62 and 471.82 for spectrum with acquisition number 1201. Returning empty spectrum.Warning: Negative intensities generated. Replaced by zeros.Warning: Negative intensities generated. Replaced by zeros.Warning: Negative intensities generated. Replaced by zeros.Warning: Negative intensities generated. Replaced by zeros.Warning: Negative intensities generated. Replaced by zeros.Warning: Negative intensities generated. Replaced by zeros.Warning: Negative intensities generated. Replaced by zeros.Warning: No data points between 471.62 and 471.82 for spectrum with acquisition number 901. Returning empty spectrum.Warning: Negative intensities generated. Replaced by zeros.Warning: Negative intensities generated. Replaced by zeros.Warning: Negative intensities generated. etc
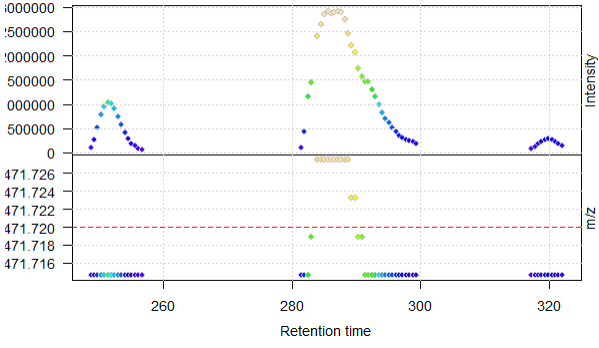
However, these warnings are still there when I use removePeaks() and clean(), which from what I have understood it, should set intensities below the set threshold to zero (removePeaks) and then remove the zero-values (clean), but they seem to be removed in the XIC-plot.
data_centroid <- data_profile %>%
  smooth(method = "SavitzkyGolay", halfWindowSize = 2L) %>%
  removePeaks(t=50000, verbose = F) %>%
  clean(verbose=F, all = T) %>%
  pickPeaks(refineMZ = "descendPeak", signalPercentage = 30, msLevel = 1L, SNR = 3, method = "MAD") %>%
  filterMsLevel(msLevel=1)
The data can still not be saved with writeMSData().
When I reduce the halfWindowSize to 1 in smooth(), I get a new error
data_centroid <- data_profile %>%
  smooth(method = "SavitzkyGolay", halfWindowSize = 1L) %>%
  removePeaks(t=50000, verbose = F) %>%
  clean(verbose=F, all = T) %>%
  pickPeaks(refineMZ = "descendPeak", signalPercentage = 30, msLevel = 1L, SNR = 3, method = "MAD") %>%
  filterMsLevel(msLevel=1)

 writeMSData(data_centroid, "MSe_RCentroid.mzML", outformat = "mzml")

#Output:
Error: BiocParallel errors
1 remote errors, element index: 1
0 unevaluated and other errors
first remote error:
Error in solve.default(t(X) %*% X): system is computationally singular: reciprocal condition number = 1.19379e-18
I have also tried to remove the smooth() function, but then I got the same error "Error in solve.default(t(X) %*% X): system is computationally singular: reciprocal condition number = 1.19379e-18"
Does anyone have any ideas of how this can be fixed so that I can save the centroided MSe data?
Thanks!
sessionInfo( )

R version 4.2.2 (2022-10-31 ucrt)
Platform: x86_64-w64-mingw32/x64 (64-bit)
Running under: Windows 10 x64 (build 19045)

Matrix products: default

locale:
[1] LC_COLLATE=English_Sweden.utf8  LC_CTYPE=English_Sweden.utf8    LC_MONETARY=English_Sweden.utf8 LC_NUMERIC=C
[5] LC_TIME=English_Sweden.utf8

attached base packages:
[1] stats4    stats     graphics  grDevices utils     datasets  methods   base

other attached packages:
[1] magrittr_2.0.3      MSnbase_2.24.2      ProtGenerics_1.30.0 S4Vectors_0.36.1    mzR_2.32.0          Rcpp_1.0.9
[7] Biobase_2.58.0      BiocGenerics_0.44.0

loaded via a namespace (and not attached):
 [1] tidyselect_1.2.0      xfun_0.35             lattice_0.20-45       colorspace_2.0-3      vctrs_0.5.0           generics_0.1.3
 [7] htmltools_0.5.3       yaml_2.3.6            vsn_3.66.0            utf8_1.2.2            XML_3.99-0.13         rlang_1.0.6
[13] pillar_1.8.1          glue_1.6.2            DBI_1.1.3             BiocParallel_1.32.5   affy_1.76.0           foreach_1.5.2
[19] affyio_1.68.0         lifecycle_1.0.3       plyr_1.8.8            mzID_1.36.0           zlibbioc_1.44.0       munsell_0.5.0
[25] pcaMethods_1.90.0     gtable_0.3.1          codetools_0.2-18      evaluate_0.18         knitr_1.41            IRanges_2.32.0
[31] fastmap_1.1.0         doParallel_1.0.17     parallel_4.2.2        fansi_1.0.3           preprocessCore_1.60.2 BiocManager_1.30.19
[37] scales_1.2.1          limma_3.54.0          MsCoreUtils_1.10.0    impute_1.72.3         ggplot2_3.4.0         digest_0.6.30
[43] dplyr_1.0.10          ncdf4_1.21            grid_4.2.2            clue_0.3-63           cli_3.4.1             tools_4.2.2
[49] tibble_3.1.8          cluster_2.1.4         pkgconfig_2.0.3       MASS_7.3-58.1         iterators_1.0.14      assertthat_0.2.1
[55] rmarkdown_2.18        rstudioapi_0.14       R6_2.5.1              MALDIquant_1.22       compiler_4.2.2
Modify Chunk OptionsRun Current Chunk


