Hello everyone,
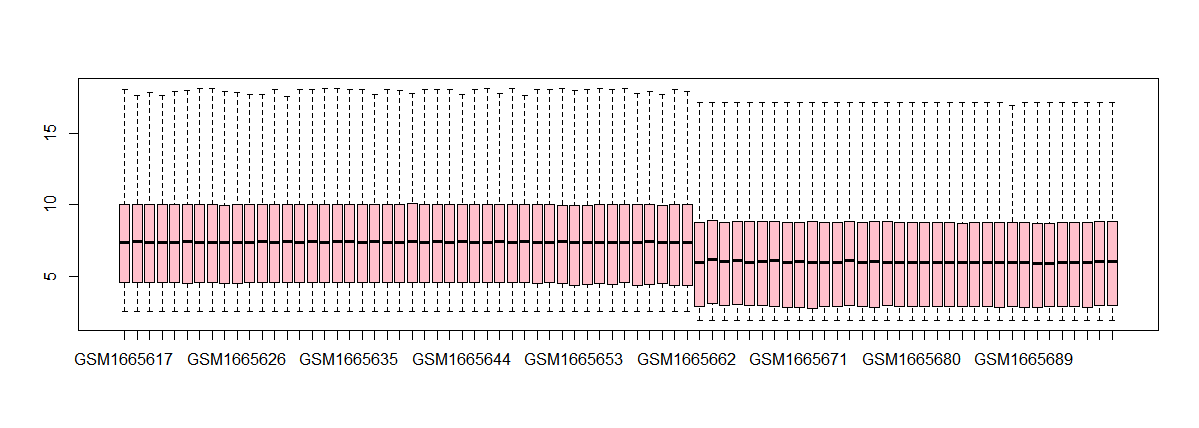
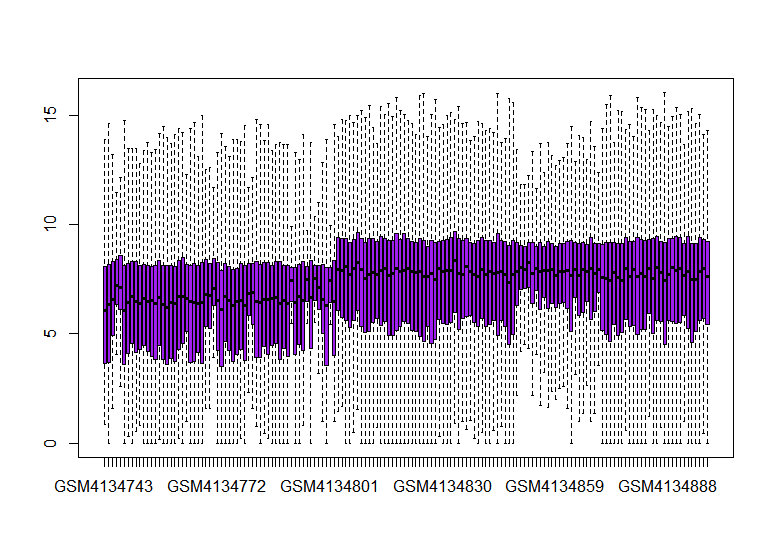
I'm a beginner in data processing and struggling with one particular case. I downloaded the GSE139255 dataset from GEO NCBI, and during analysis in R I realized extensive distribution of values before and after the log2 transformation1. Can you help me how to normalize the data? Also, in some other cases, I realized that set of samples has a uniform but higher distribution than another set of samples 2.
Both samples can be seen in the attached plots
Micro Array GEO data analysis
0
Entering edit mode
Similar Posts
Loading Similar Posts
Traffic: 541 users visited in the last hour
Use of this site constitutes acceptance of our User Agreement and Privacy Policy.


