Too many differentially expressed miRNA with limma
2
0
Entering edit mode
Sara ▴ 20
@sara-9865
Last seen 2.1 years ago
Germany

Dear all,

I am analyzing two independent miRNA expression datasets from Agilent platforms, GSE95855 and GSE208159. I used the Series Matrix File that contained the normalized expression values. However, I got too many differential expressed miRNA, (about 80% of total miRNAs). Since it is my first experience to analyze such a data, could you please take a look at my codes and kindly tell me what's wrong?

> x <- read.table("gse95855.txt", sep="\t", header=TRUE, stringsAsFactors = FALSE, fill=TRUE)
> x <- data.matrix(x[,2:ncol(x)])
> rownames(x) <- probes
> head(x[,1:3])
                GSM2527071 GSM2527072 GSM2527073
rno-let-7a-1-3p  -3.283962  -3.273210  -3.253303
rno-let-7a-5p     9.756434   9.567634   9.756434
rno-let-7b-3p    -3.283962  -3.273210  -3.253303
rno-let-7b-5p    11.074507  11.074507  11.074507
rno-let-7c-1-3p  -3.283962  -3.273210  -3.253303
rno-let-7c-5p    10.604004  10.604004  10.604004

> x <- na.omit(x)
> boxplot(x, las=2) 
> targets <- read.table("targets.txt", header=TRUE, sep="\t")
# DE analysis
> group <- factor(targets$group, levels=c("control","Mi"))
> design <- model.matrix(~group)
> colnames(design) <- c("control","Mivscontrol")
> design
  control Mivscontrol
1       1           0
2       1           0
3       1           0
4       1           1
5       1           1
6       1           1
attr(,"assign")
[1] 0 1
attr(,"contrasts")
attr(,"contrasts")$group
[1] "contr.treatment"

> fit <- lmFit(x,design)
> fit <- eBayes(fit,trend=TRUE,robust=TRUE)
> topTable(fit,coef=2)

> summary(decideTests(fit,method = "global"))
       control Mivscontrol
Down       640         643
NotSig      22          84
Up          96          31

Also, enter image description here is box plot of data (Series Matrix File), is it really normal in your view?
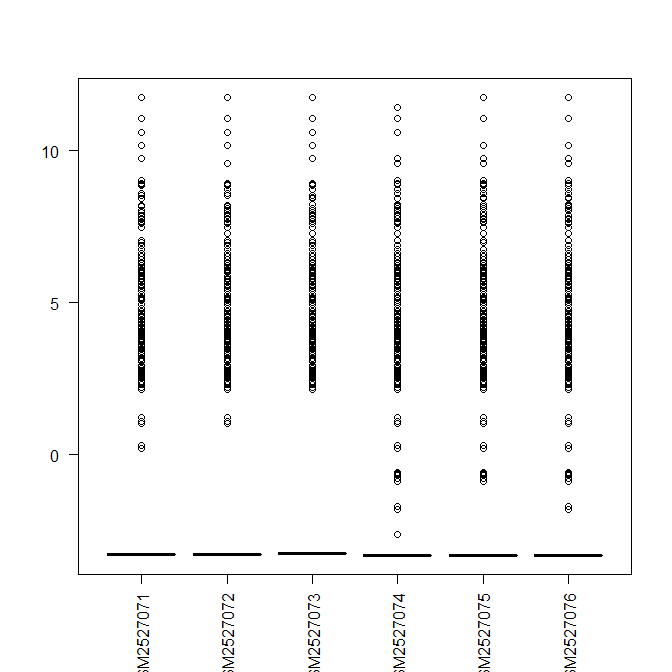
Many thanks for your advice

limma miRNA Microarray • 1.8k views
ADD COMMENT
0
Entering edit mode

Have you looked at logFC ? In the original paper they took fold change ≥ 2.0 and a P value ≤ 0.1

ADD REPLY
3
Entering edit mode
@james-w-macdonald-5106
Last seen 4 hours ago
United States

For miRNA data you usually need to remove those miRNAs that are not expressed in most if not all of the samples. If you used plotDensities from the limma package you could see that you have a bimodal distribution, with the vast majority of miRNA transcripts having values well below zero. The expression values for those probes are almost pure noise and aren't reliable.

> library(GEOquery)
>  z <- getGEO("GSE95855")[[1]]
Found 1 file(s)
GSE95855_series_matrix.txt.gz

> sum(rowSums(exprs(z) < 0) == 6L)
[1] 626

## that's like 82% of the probes! 
## we can filter out any miRNA where 3 or more samples are below zero

> zsmall <- z[rowSums(exprs(z) < 0) <= 3,]

> fit <- eBayes(lmFit(zsmall, model.matrix(~gl(2,3))))
> summary(decideTests(fit))[,2]
  Down NotSig     Up 
    10     89     17
ADD COMMENT
2
Entering edit mode
@gordon-smyth
Last seen 5 hours ago
WEHI, Melbourne, Australia

There are three problems with your analysis:

  1. You haven't filtered unexpressed probes. As James points out, most of the probes are not detected in any sample, and simply filtering them out would solve most of the problems. If you look at the data you show in your question, the 1st, 3rd and 5th rows are all equal to the same negative value. James has suggested a simple and effective filtering strategy. If you want to be more sophisticated, I would use the gIsWellAboveBG Agilent attribute for filtering, as is demonstrated in Section 17.4.6 of the limma User's Guide.

  2. You haven't normalized. The original paper applied quantile normalization, but it isn't entirely clear whether that has been applied to the data you are analyzing. In any case, it would be better to reapply normalization after filtering.

  3. You have used method="global" inappropriately. In your analysis, the first contrast is just the intercept, which has no biological meaning as a differential expression test. You should not be using method="global" to connect the contrast of interest with one that is of no interest. Just leave the argument at its default value.

ADD COMMENT
0
Entering edit mode

Does trend=TRUE does any global harm here since it's not counts?

ADD REPLY
1
Entering edit mode

trend=TRUE is not only for counts. For microarrays, background correction can cause a decreasing mean-variance relationship. It doesn't do any harm here and may slightly improve the analysis.

ADD REPLY
0
Entering edit mode

James and Gordon, many thanks for your nice explanation!

Sorry, just one question about log2 transformation. Here, I noticed that some miRNAs (eg. rno-miR-152-3p and rno-miR-199a-5p) expressed only in case (Mi) group, not control, actually they have the negative expression values in the control group. So, they tend to be interesting DE. However, in the case of log transformation, these negative values converted to NA and don't consider for DE analysis, so we simply missed them due to log transformation. Could you please tell me your suggestion in this situation?

by the way, here is the boxplot before and after log2 transformation.

Thanks

ADD REPLY

Login before adding your answer.

Traffic: 813 users visited in the last hour
Help About
FAQ
Access RSS
API
Stats

Use of this site constitutes acceptance of our User Agreement and Privacy Policy.

Powered by the version 2.3.6