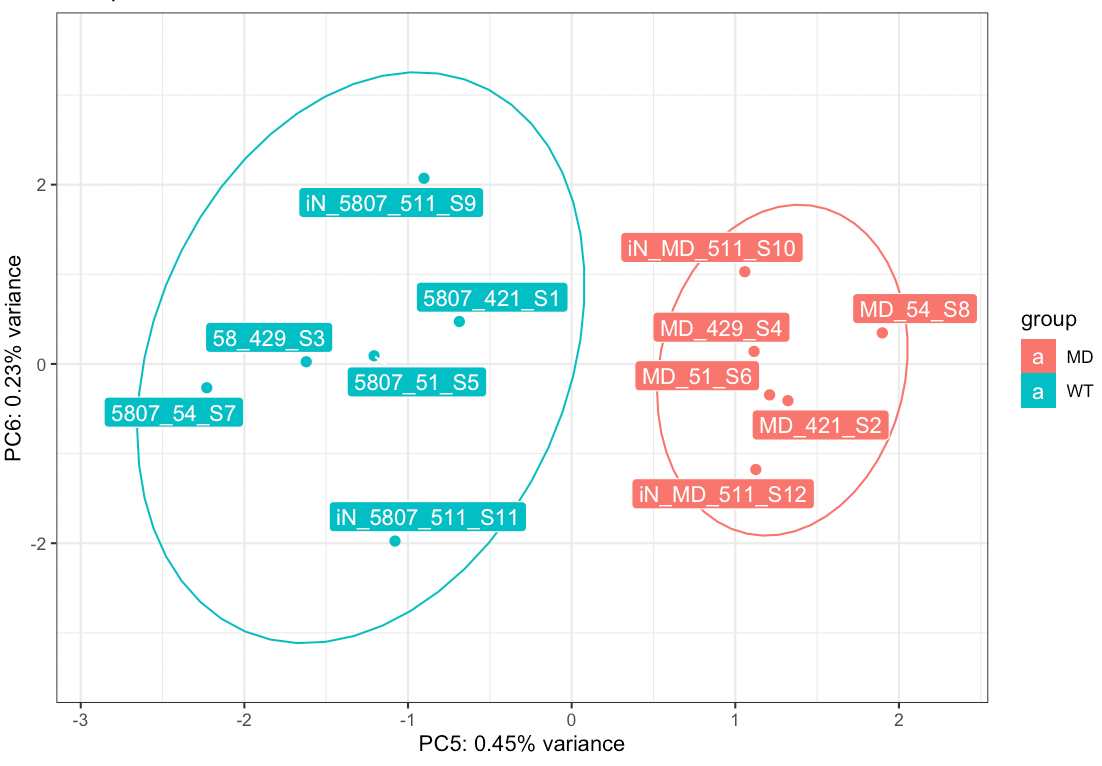
Looking at the principal components of our RNASeq data, there is clear separation between the diseased and controlled, however, this separation is in the 5th principal component, which only accounts for 0.45% of variance. There is no clear separation in the lower dimensions, which mostly show batch separation.
How can I statistically leverage the genes associated with this PC when they aren't differentially expressed in DESeq2? I've attached an image of the plot.


You could perform GO on the genes that contribute the most to the variation along PC5, but indeed there is very very small difference between disease and control samples. Have you tried to perform a GSEA ?