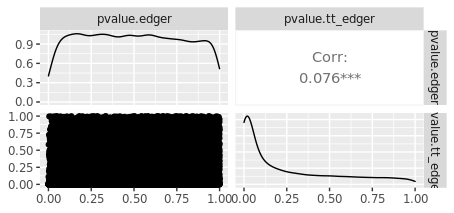
I am trying to analyze some data with the tidybulk package. This tutorial is great
I have a paired design as described in section 3.4.1 in the edgeR guide. I have 4 independent subjects and each has a pre-treatment (control) and post-treatment sample. I want to see what genes were differential expressed in each subject after treatment.
My base R code is as such:
library(edgeR)
data=read.csv("~/Rmd_docs/transcriptome_counts.csv")
data=mutate(data, new_sample_name=paste(subjectID, ifelse(Visit=='Screening',"Pre","Post"),sep="-"))

samplenames <- c("115-20407-Post", "115-20407-Pre",
                 "115-20413-Post", "115-20413-Pre",
                 "126-20408-Post", "126-20408-Pre",
                 "142-20104-Post", "142-20104-Pre")
subjectids <- c("115-20407", "115-20407",
                "115-20413", "115-20413",
                "126-20408", "126-20408",
                "142-20104", "142-20104")
treatments <- c("T","C",
                "T", "C",
                "T", "C",
                "T","C")
targets <- data.frame (samplenames, subjectids, treatments)

Subject <- factor(targets$subjectids)
Treat <- factor(targets$treatments, levels=c("C","T"))
design <- model.matrix(~ Subject + Treat)

data_mat=dcast(data, gene~ new_sample_name, value.var = "raw_count")

y <- DGEList(counts=data_mat[,2:9], genes=data_mat[,1], group = Treat)

#filter and normalize
keep <- filterByExpr(y, design)
y <- y[keep,,keep.lib.sizes=FALSE]


y_normed <- calcNormFactors(y)
rownames(design) <- colnames(y_normed)
y_normed <- estimateDisp(y_normed, design, robust=TRUE)

fit <- glmQLFit(y_normed, design)
qlf <- glmQLFTest(fit)
topTags(qlf)
# include your problematic code here with any corresponding output
# please also include the results of running the following in an R session

sessionInfo( )
For my tidybulk code, I have a file with sampleID, subjectID, gene, raw count, and treated (logical column)
library(tidybulk)
tb_counts=tidybulk(counts_indication_df, .sample = sampleID, .transcript = gene, .abundance = raw_count)
counts_scaled_df <- tb_counts %>%
    keep_abundant(factor_of_interest = Treated) %>%
    scale_abundance()

counts_de <- counts_scaled_df %>%
  test_differential_abundance( ~ subjectID + Treated) # is this correct for paired-design
But when I compare p-values from tidybulk edgeR with my base R edgeR results, they are not any where close to being the same:
I must be misunderstanding how to correctly specify the design matrix for paired experiments. I would appreciate any help.


For edgeR the opposite is true, because edgeR by default tests for the last coefficient in the linear model. That is most easily seen by typing
args(glmQLFTest)or by consulting the help page forglmQLFTestorglmLRT. DESeq2 is the same as edgeR.If you have changed the default contrast from that of edgeR and DESeq2, then that would explain the difference in the results.
Thanks Gordon, I had a look
that's indeed the case. I was so used to think about the first covariate as the factor of interest, e.g.
that I ended up embedding it into the pipeline design (convention documented here
?test_differential_abundance).I will ponder if it is appropriate at this stage to revert the hard coding and give the option as an additional argument. Amit, maybe as a user, you can give your opinion about this. As a note, if the first factor is categorical with > 2 values, then the
contrastsargument should be used (I will soon improve documentation/messaging on this aspect).Thanks for your replies Stefano and Gordon, I really appreciate it. After carefully reading the docs for test_differential_expression:
But in edgeR the default is the last coefficient in the design matrix. Indeed, when I print the column names of the design matrix for my tidybulk object and edgeR object, TreatedT is the first coefficient for tidybulk and the last for edgeR. After realizing this, my results are the same between the two different methods.
I would suggest for tidybulk to keep the same default as edgeR because this caused a lot of confusion for me, as I'm new to tidybulk and edgeR
Amit