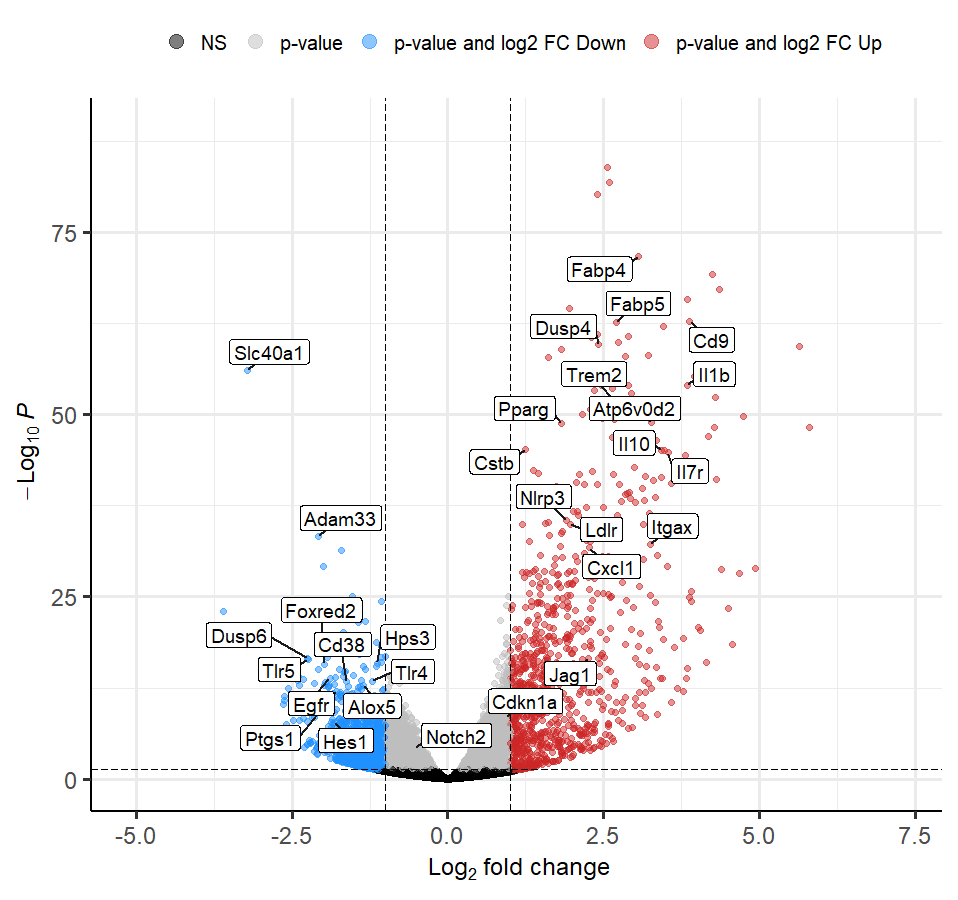
Hi,
I am trying to plot a volcano plot using custom colors and I'd like to use legend labels containing subscript e.g. log2.
When I use colCustom argument, legendLabels argument does not work and use of expression function in named vector is not supported.
- Do you know if there is a way to replace the names of keyvals by legend labels in order to be able to use the expression function and add subscripts to legend text?
- Is it possible to hide/remove the legend completely from the plot?
I used the following code to create custom colors and plot:
# create custom key-value pairs for 'high', 'low', 'mid' expression by fold-change
# this can be achieved with nested ifelse statements
keyvals <- ifelse(res$pvalue <= 0.05,
                  ifelse(res$log2FoldChange < -1,
                         'dodgerblue',
                         ifelse(res$log2FoldChange > 1,
                                'firebrick3',
                                'grey')),
                  ifelse(res$log2FoldChange < -1,
                         'black',
                         ifelse(res$log2FoldChange > 1,
                                'black',
                                'black'))
)

keyvals[is.na(keyvals)] <- 'grey'
names(keyvals)[keyvals == 'dodgerblue'] <- "p-value and log2 FC Down"
names(keyvals)[keyvals == 'grey'] <- 'p-value'
names(keyvals)[keyvals == 'firebrick3'] <- "p-value and log2 FC Up"
names(keyvals)[keyvals == 'black'] <- "NS" #'low & non sign'
names(keyvals)[keyvals == 'black'] <- "NS" #'mid & non sign'
names(keyvals)[keyvals == 'black'] <- "NS" #'high & non sign'

x = EnhancedVolcano(res,
                    lab = res$Genes,
                    x = 'log2FoldChange',
                    y = 'pvalue',
                    selectLab = genes_to_draw,
                    FCcutoff = 1,
                    pCutoff = 0.05,
                    colCustom = keyvals,
                    # col = c("yellow", "green", "grey", "firebrick3"), # non-sign/nonFC, non-sign/FC, sign/nonFC, sign/FC
                    drawConnectors = TRUE,
                    arrowheads = FALSE,
                    widthConnectors = 1,
                    lengthConnectors =  unit(1, "cm"),
                    boxedLabels = TRUE,
                    # legend = c("NS", "p-value", "p-value and log2 FC Down", "p-value and log2 FC Up"),
                    # legendLabels = c('NS', 'p-value', expression(p-value~and~Log[2]~FC), expression(p-value~and~Log[2]~FC)),
                    legendLabSize = 15,
                    title = NULL, subtitle = NULL, caption = NULL)
print(x)

sessionInfo( )
R version 4.1.2 (2021-11-01)
Platform: x86_64-w64-mingw32/x64 (64-bit)
Running under: Windows 10 x64 (build 19043)

Matrix products: default

locale:
[1] LC_COLLATE=Greek_Greece.1253  LC_CTYPE=Greek_Greece.1253    LC_MONETARY=Greek_Greece.1253 LC_NUMERIC=C                  LC_TIME=Greek_Greece.1253
system code page: 1252

attached base packages:
[1] stats     graphics  grDevices utils     datasets  methods   base

other attached packages:
[1] EnhancedVolcano_1.12.0 ggrepel_0.9.1          ggplot2_3.3.6

loaded via a namespace (and not attached):
  [1] ggbeeswarm_0.6.0      colorspace_2.0-3      rjson_0.2.21          deldir_1.0-6          ellipsis_0.3.2        circlize_0.4.15       htmlTable_2.4.1
  [8] GlobalOptions_0.1.2   base64enc_0.1-3       fs_1.5.2              clue_0.3-61           rstudioapi_0.14       farver_2.1.1          remotes_2.4.2
 [15] fansi_1.0.3           codetools_0.2-18      splines_4.1.2         extrafont_0.18        doParallel_1.0.17     cachem_1.0.6          knitr_1.40
 [22] pkgload_1.3.0         Formula_1.2-4         Rttf2pt1_1.3.11       cluster_2.1.2         png_0.1-7             shiny_1.7.2           compiler_4.1.2
 [29] backports_1.4.1       assertthat_0.2.1      Matrix_1.5-1          fastmap_1.1.0         cli_3.4.1             later_1.3.0           htmltools_0.5.3
 [36] prettyunits_1.1.1     tools_4.1.2           gtable_0.3.1          glue_1.6.2            dplyr_1.0.10          maps_3.4.0            Rcpp_1.0.9
 [43] cellranger_1.1.0      vctrs_0.4.2           ggalt_0.4.0           extrafontdb_1.0       iterators_1.0.14      xfun_0.33             stringr_1.4.1
 [50] ps_1.7.1              openxlsx_4.2.5        mime_0.12             miniUI_0.1.1.1        lifecycle_1.0.3       devtools_2.4.5        MASS_7.3-54
 [57] scales_1.2.1          promises_1.2.0.1      parallel_4.1.2        proj4_1.0-11          RColorBrewer_1.1-3    ComplexHeatmap_2.13.1 memoise_2.0.1
 [64] gridExtra_2.3         ggrastr_1.0.1         rpart_4.1-15          latticeExtra_0.6-30   stringi_1.7.8         S4Vectors_0.32.4      corrplot_0.92
 [71] foreach_1.5.2         checkmate_2.1.0       BiocGenerics_0.40.0   pkgbuild_1.3.1        zip_2.2.1             shape_1.4.6           rlang_1.0.6
 [78] pkgconfig_2.0.3       matrixStats_0.62.0    lattice_0.20-45       purrr_0.3.5           labeling_0.4.2        htmlwidgets_1.5.4     processx_3.7.0
 [85] tidyselect_1.2.0      magrittr_2.0.3        R6_2.5.1              IRanges_2.28.0        generics_0.1.3        Hmisc_4.7-1           profvis_0.3.7
 [92] DBI_1.1.3             pillar_1.8.1          foreign_0.8-81        withr_2.5.0           survival_3.2-13       nnet_7.3-16           ash_1.0-15
 [99] tibble_3.1.8          crayon_1.5.2          interp_1.1-3          KernSmooth_2.23-20    utf8_1.2.2            urlchecker_1.0.1      jpeg_0.1-9
[106] GetoptLong_1.0.5      usethis_2.1.6         grid_4.1.2            readxl_1.4.1          data.table_1.14.4     callr_3.7.2           digest_0.6.29
[113] xtable_1.8-4          httpuv_1.6.6          stats4_4.1.2          munsell_0.5.0         beeswarm_0.4.0        vipor_0.4.5           sessioninfo_1.2.2


Hi,
First of all thank you for the great package and the quick response.
The trick with
legendPosition = "none"works fine, you may want to add it in the manual along with the ’top’, ’bottom’, ’left’, ’right’.As for the
parseLabels, I set it toTRUEbut when running theEnhancedVolcanofunction got the following error:The modified code used is as follows:
If I remove the
legendargument (the one that caused the error), it works but showing thenames(keyvals)aslegendLabels.Same behavior with the first option
Any ideas?