
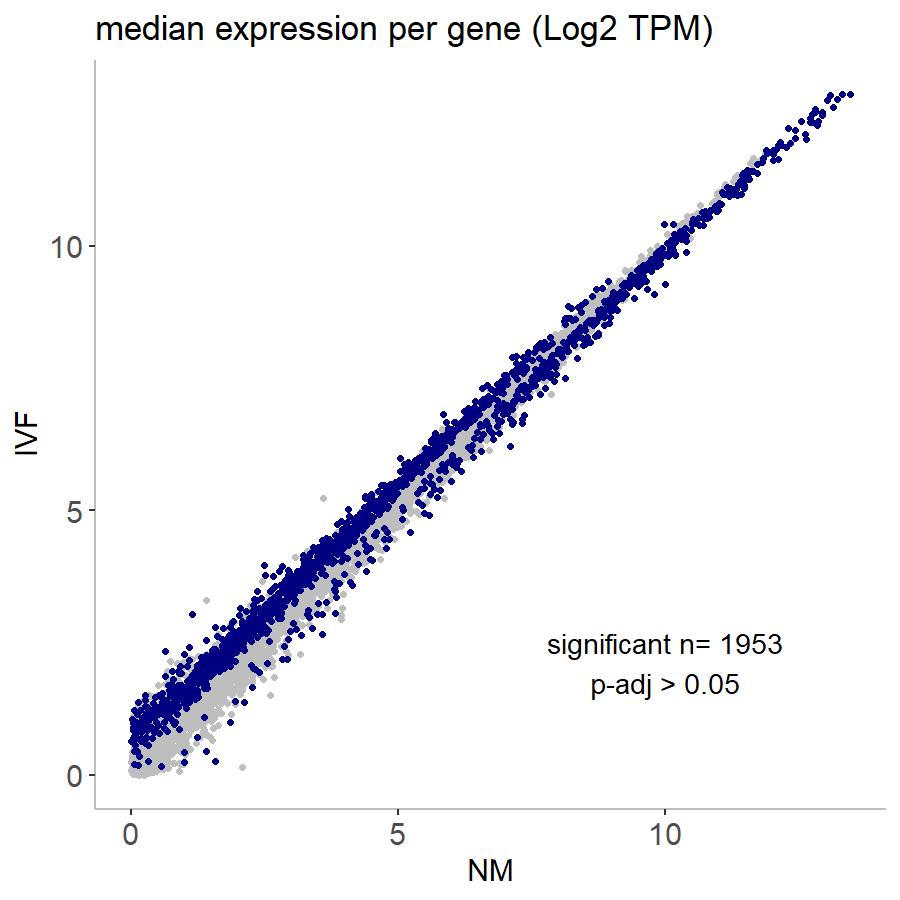
When I run DESeq2 to call differential expression in my data set, I get this strange pattern. I have two experimental conditions, "NM" and "IVF". When I compare them, you can see in the TPM plot that differential expression in very highly expressed genes is almost completely in the NM group, whereas DE in lowly expressed genes is in the IVF group (highlighted in navy). This seems like it could be a technical artifact as I have run similar types of sequencing experiments with different treatments and it has never looked like this. I have also checked the number of genes expressed in each treatment and they look very similar so I don't think that's the problem. Is there any way to correct for this? Or even to know if it's biological or technical? This is an RNA-seq experiment where each sample is an individual embryo so it is a very low-input experiment but I have ~50 samples for each treatment group. Any help would be very much appreciated!
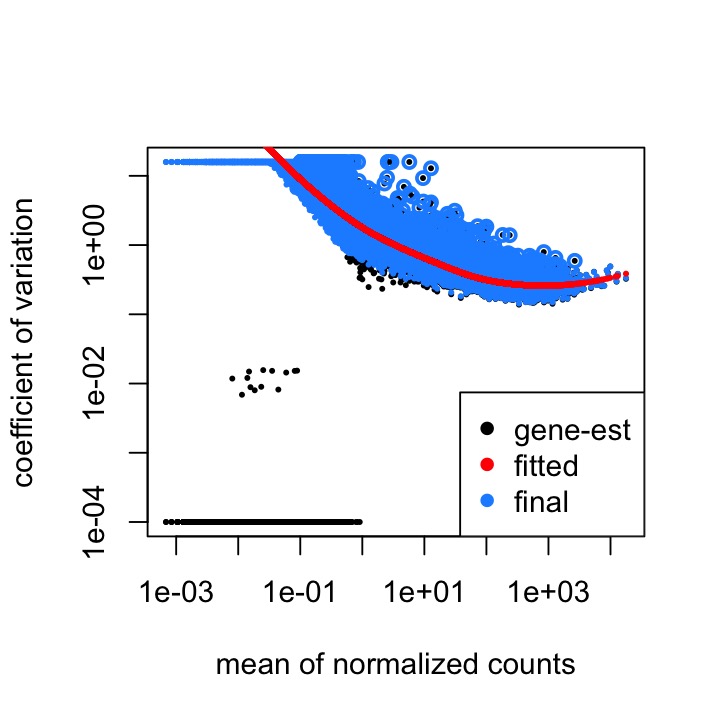
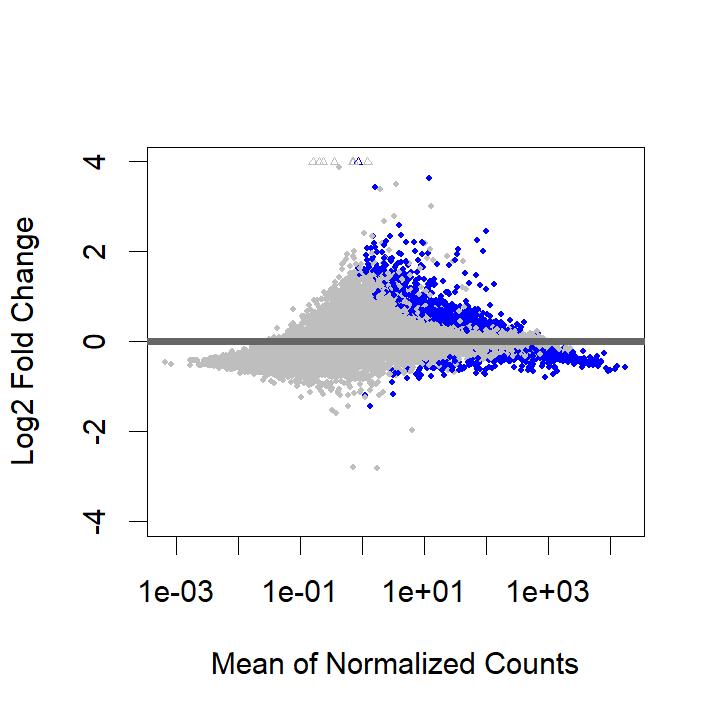
The dispersion estimates plot seems to be normal, but you can see the skew in the MA plot:
The code I used to run DESeq is below:
deseq_input <- DESeqDataSetFromMatrix(rawcounts, treatment, ~ART_type+Pseudostage, tidy=TRUE)
deseq_output <- DESeq(deseq_input, fitType = "local")
deseq_results <- results(deseq_output, contrast=c("ART_type","IVF","NM"), pAdjustMethod = "fdr")
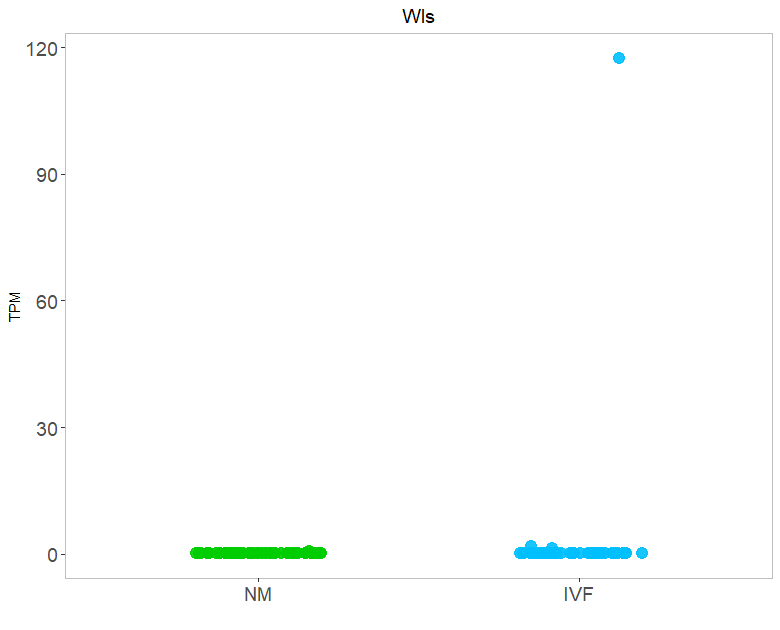
I also get a large number of genes that are called as DE but only due to a few outlier samples (see plot of gene TPM below). This is after removing obvious outliers using a PCA plot, so these are not the same few samples from gene to gene (otherwise I would just remove the problem samples). Is there any way to tell DESeq not to call these genes as DE?

Agree with providing the genes with say, baseMean > 1000 to the controlGenes argument of estimateSizeFactors, before running DESeq(). For this particular dataset, you need to provide additional information than just relying on in silico normalization over all genes.
Thanks for the responses. I tried the suggestions, adding pre-filtering and calculating size factors based on genes with baseMean>1000 using the following code:
However, I get the following MA plot:
So, now almost all DE genes are overexpressed in the IVF treatment. This doesn't seem possible biologically. When I look at the results call, I get a much higher number of DE genes after filtering baseMean, with 55% of genes overexpressed:
I also tried using lfcShrink using the three different types:
I get the following plots:
As far as I understand, the ashr option does the best job at shrinkage. However, I get error messages with that option such as:
I'm not sure what's causing these as the apeglm and normal settings don't cause any errors.
I have also tried changing the lfcThreshold option but I don't really understand how to optimize this. I tried with a 1.5 fold change and I get vastly different results (see below). I don't want to pick an arbitrary number...what's the best way to set a cutoff here?
I apologize for the long post and thanks again for any help!
And yet you have many genes with an LFC that is larger than what appears to be the "non-changing" LFC at the x-axis. And it is precise. You can look at these genes with high LFC with plotCounts. I guess the question is, why are these genes having larger LFC than the ones that are on the x-axis? And if you don't care about positive LFC, then you should use the LFC threshold.
This has to be chosen based on the biological interpretation. You have said that the genes with positive LFC but small are maybe not "plausible" or maybe not practically important in this experiment. Then you need to set a threshold of practical significance.