DiffBind spike-in normalization
2
0
Entering edit mode
@yuhuihui2011-23030
Last seen 2.0 years ago
United States

Hello:

Dose anyone have experiences in using DiffBind for spike-in normalization? I have dm6 spike-in for both input and IP samples. I have aligned bam files for each sample with both human and drosophila genomes, i.e, each sample has four bam files: two input bam files for hg19 and dm6, and two IP bam file for hg19 and dm6 (see below) . In the example of user guild of DiffBind, there is only one spike-in for each sample in column Spikein in the sample-sheet. How can I use the spikein for both input and IP samples? Or can you give me suggestions to how to set up the sample-sheet?

bam_files:

C1_IP_hg19.bam, C1_IP_dm6.bam, C1_input_hg19.bam, C1_input_dm6.bam,

C2_IP_hg19.bam, C2_IP_dm6.bam, C2_input_hg19.bam, C2_input_dm6.bam,

C3_IP_hg19.bam, C3_IP_dm6.bam, C3_input_hg19.bam, C3_input_dm6.bam,

T1_IP_hg19.bam, T1_IP_dm6.bam, T1_input_hg19.bam, T1_input_dm6.bam,

T2_IP_hg19.bam, T2_IP_dm6.bam, T2_input_hg19.bam, T2_input_dm6.bam,

T3_IP_hg19.bam, T3_IP_dm6.bam, T3_input_hg19.bam, T3_input_dm6.bam

C is control and T is treatment.

Thanks

DiffBind • 4.4k views
ADD COMMENT
0
Entering edit mode
Rory Stark ★ 5.2k
@rory-stark-5741
Last seen 4 weeks ago
Cambridge, UK

DiffBind only uses the IP spike-in counts to normalize the efficiency of the IP, so you should supply those as the spike-in tracks (and leave out the drosophila Input reads). This is discussed in Section 7.6 of the DiffBind vignette.

If you know of a published method that uses exogenous reads for both IP and Input. let me know and I'll look into adding it to the package.

ADD COMMENT
0
Entering edit mode

Hello Rory,

I found a bug in DiffBind3. The parameter "fold" in dba.report and dba.plotVolcano will filter out negative values (see example below). I tested DiffBind 3.4.11 and 3.6.5. The bug exists in both versions.

dba.report(DBAobject)
GRanges object with 8344 ranges and 6 metadata columns:

dba.report(DBAobject, fold=1)
NULL
Warning message:
No sites above threshold.

When I checked the results, all the regions have Fold < 0. So I think the threshold fold = 1 will filter out all negative fold values, and it should be abs(log2(fold)) >=1. Did you forget to use abs() in your scripts?

ADD REPLY
0
Entering edit mode

The fold parameter does respect abs(). You can see this with the example dataset:

data(tamoxifen_analysis)
rep1 <- dba.report(tamoxifen)
length(rep1)  #783
sum(rep1$Fold < 0) #595
sum(abs(rep1$Fold)>1) #772

rep2 <- dba.report(tamoxifen, fold=1)
length(rep2) #189
sum(rep2$Fold < 0) #157

It is important to note that when you specify a fold value for the report, all the confidence statistics are recalculated. This is because the request is interpreted as changing the null hypothesis from a basis of fold=0 to fold=1. In the above example, you can see that in the default report, there were 772 sites with a FDR < 0.05 that have an absolute log fold change greater than 1, while in the report where fold=1 is specified, there are only 189 sites that still have FDR < 0.05.

You may want to try the fold=1 report with th=1 to retrieve all the sites and see how the FDR calculations have changed.

ADD REPLY
0
Entering edit mode

Thank you. Yes, you are right. FDR calculations have changed when I set fold=1 report with th=1. It is a little strange for me that the FDR dependents on threshold of fold. For our datasets, all the fold values are negative and the signals are very strong when checked in IGV. But when I set fold = 1, there were no sites with FDR < 0.05. For me, FDR should be a global setting and does not depend on fold settings.

ADD REPLY
0
Entering edit mode

The idea is that when you are looking to identify changes above a certain fold threshold, you have changed the null hypothesis from "no change" to "no change greater than fold", which requires a more stringent computation of FDR values.

You can isolate the sites with greater fold changes using the "no change" null pretty easily:

rep1 <- dba.report(tamoxifen)
rep1 <- rep1[abs(rep1$Fold)<1,]
ADD REPLY
0
Entering edit mode

Yes, I have used these codes to filter the results and got quite good results. I think we should warn the users for this special settings. Maybe someone else may encounter the same issues. For most of the users, DiffBind is a good software but a little complex to use.

Thank you very much!

ADD REPLY
0
Entering edit mode

I do find a paper that uses spike-in for both IP and Input: https://pubmed.ncbi.nlm.nih.gov/29107533/

enter image description here

ADD REPLY
1
Entering edit mode

This method would be straightforward to add to DiffBind, I'll add it to the feature request list.

ADD REPLY
0
Entering edit mode
@yuhuihui2011-23030
Last seen 2.0 years ago
United States

Thanks. I used only IP spike-in and got the following error. Could you please tell what's wrong here.

x <- dba.normalize(entity, spikein = T)

Generating counts for spike-ins... Error in h(simpleError(msg, call)) : error in evaluating the argument 'object' in selecting a method for function 'sizeFactors': error in evaluating the argument 'object' in selecting a method for function 'estimateSizeFactors': all samples have 0 counts for all genes. check the counting script.

sessionInfo()

R version 4.1.2 (2021-11-01)

Matrix products: default BLAS: /usr/lib64/libblas.so.3.4.2 LAPACK: /usr/lib64/liblapack.so.3.4.2

locale: [1] C

attached base packages: [1] stats4 stats graphics grDevices utils datasets methods
[8] base

other attached packages: [1] DiffBind_3.4.11 SummarizedExperiment_1.24.0 [3] Biobase_2.54.0 MatrixGenerics_1.9.1
[5] matrixStats_0.62.0 GenomicRanges_1.46.1
[7] GenomeInfoDb_1.30.1 IRanges_2.28.0
[9] S4Vectors_0.32.4 BiocGenerics_0.40.0
[11] dplyr_1.0.10

ADD COMMENT
0
Entering edit mode

For some reason, all of the drosophila counts are coming up as zero (no aligned reads). There could be an issues with your bam files - I'd need access to them in order to see what is heppening.

You can try setting normalize = DBA_NORM_LIB:

x <- dba.normalize(entity, spikein = T, normalize = DBA_NORM_LIB )

This may give a more informative error message. If it returns successfully, you can check how many aligned reads are being counted:

bgEx <- dba.normalize(x, method=DBA_ALL_METHODS, bRetrieve=TRUE)$background$binned
colData(bgEx)

and see if the "totals" column contains non-zero values.

ADD REPLY
0
Entering edit mode

I did that as you suggested and the 'totals' for all samples are zero!

ADD REPLY
0
Entering edit mode

And the second time gave an error:

x <- dba.normalize(entity, spikein = T, normalize = DBA_NORM_LIB )

Generating counts for spike-ins... Error in .local(object, ..., value) : all(!is.na(value)) is not TRUE

ADD REPLY
0
Entering edit mode

If you can give me access to one of the drosophila IP bam files, I can have a look at what is going on.

ADD REPLY
0
Entering edit mode

I can show you first 20 lines of the bam file:

@HD VN:1.0 SO:coordinate @SQ SN:chr2L LN:23513712 @SQ SN:chr2R LN:25286936 @SQ SN:chr3L LN:28110227 @SQ SN:chr3R LN:32079331 @SQ SN:chr4 LN:1348131 @SQ SN:chrM LN:19524 @SQ SN:chrX LN:23542271 @SQ SN:chrY LN:3667352 @PG ID:bwa PN:bwa VN:0.7.17-r1188 A00220:372:HFJCMDRX2:1:2256:30572:19053 99 chr2L 4963 29 51M = 5165 253 AGAGTAGTGCCAACATATTGTGCTCTCTATATAATGACTGCCTCTCATTCT FFFFFFFFFFFFFFFFFFFFFFFFFFFFFFFFFFFFFFFFFFFFFFF:FFF XT:A:R A00220:372:HFJCMDRX2:1:2204:3396:21465 99 chr2L 6029 60 51M = 6035 57 TTTCTCATCCATATAAATACTACCGAAAATGACTGTCTAAAGGTACTCATC FFFFFFFFFFFFFFFFFFFFFFFFFFFFFFFFFFFFFFFFFFFFFFFFFFF XT:A:U A00220:372:HFJCMDRX2:1:2222:3821:5447 83 chr2L 6076 60 51M = 5865 -262 CATCGACTATATTTAAATCTGTGTATTTCTGTGAATAGATTGACCTTTGCA FFFFFFFFFFFFFFFFFFFFFFFFFFFFFFFFFFFFFFFFFFFFFFFFFFF XT:A:U A00220:372:HFJCMDRX2:1:2201:29794:22811 99 chr2L 6316 60 51M = 6395 130 AGTTCCAATAGACTGGAAATTATTTTGCAATATCATTTTTATCCCTATTTC FFFFFFFFFFFFFFFFFFFFFFFFFFFFFFFFFFFFFFFFFFFFFFFFFFF XT:A:U A00220:372:HFJCMDRX2:2:2177:26087:28948 99 chr2L 6508 60 51M = 6704 247 TGTGCGATTTCACTTTAATTCTTATTTCAAAAAAGTTAATTATTAGTTGAC FFFFFFFFFFFFF:FFFFFFFFFFFFFFFFFFF:F:FFFFFFFFFFFFFFF XT:A:U A00220:372:HFJCMDRX2:2:2225:20238:5008 83 chr2L 6601 60 51M = 6508 -144 AAATGGCGGCGCAAAAGGATGGTTGCATATGCAATAACTTCATCTCATTCA FFFFFFFFFFFFFFFFFFFFFFFFFFFFFFFFFFFFFFFFFFFFFFFFFF: XT:A:U A00220:372:HFJCMDRX2:1:2216:2202:36245 99 chr2L 6717 60 51M = 6751 85 TGGGACAAAAATGATAGGTCACGCGAGAGGAGTGGTCTAAATTTTACTCTC ,FFFFFFFFF:FF:FFFFFFFFFFFFFFFFFFFFFFFFFFFFFFFFFFFFF XT:A:U A00220:372:HFJCMDRX2:1:2229:26874:16344 83 chr2L 7215 60 51M = 7159 -107 AATACCAATACATTGGGAATAATTTGCGATTTCATTCTATTCTTATGCCCA :FFFFFFFFFFFFFFFFFFFFFF:FFFFFFFFFFFFFFFFFFFFFFFFFFF XT:A:U A00220:372:HFJCMDRX2:2:2221:17517:30420 83 chr2L 7864 60 51M = 7778 -137 ACTCGGATGCTGTGCGTCTAAGCCAGAATGGCTTCGCCAACTCCCGCGTAA FFFFFFF:FFFFFF:FFFFFFFFFFFFFFFFFFFFF:FFFFFFFFF,FFF: XT:A:U

ADD REPLY
0
Entering edit mode

And here is the output from samtools idxstats:

chr2L 23513712 36272 0
chr2R 25286936 39758 0
chr3L 28110227 42074 0
chr3R 32079331 47476 0
chr4 1348131 3392 0
chrM 19524 81 0
chrX 23542271 23798 0
* 0 0 0

ADD REPLY
0
Entering edit mode

samtools flagstat?

ADD REPLY
0
Entering edit mode

192935 + 0 in total (QC-passed reads + QC-failed reads)
192935 + 0 primary
0 + 0 secondary
0 + 0 supplementary
0 + 0 duplicates
0 + 0 primary duplicates
192935 + 0 mapped (100.00% : N/A)
192935 + 0 primary mapped (100.00% : N/A)
192935 + 0 paired in sequencing
192935 + 0 read1
0 + 0 read2
192935 + 0 properly paired (100.00% : N/A)
192935 + 0 with itself and mate mapped
0 + 0 singletons (0.00% : N/A)
0 + 0 with mate mapped to a different chr
0 + 0 with mate mapped to a different chr (mapQ>=5)

ADD REPLY
0
Entering edit mode

I think only the total number of reads (here is 192935) should be used by DiffBind for spike-in normalization. The counting script is wrapped in dba.normalization and is hard to modify. Can we just use our own method or you can provide a separate method for counting and just add the counts for normalization?

ADD REPLY
0
Entering edit mode

You can supply a vector of library sizes using the library = parameter and setting normalize = DBA_NORM_LIB. This should work if you supply the number of reads.

The default spikein method does something beyond this, dividing the reads into bins and applying a RLE normalization calculation.

ADD REPLY
0
Entering edit mode

Thank you. I used the library sizes from IP spikeins and normalize = DBA_NORM_LIB for normalization and got only four significant diffbind regions. I can get 12k regions without using spikeins. This is indeed a tricky!

ADD REPLY
0
Entering edit mode

Hi Stark,

Sorry I have one more question. Since I failed to use IP spike-in for normalization, I sought to use other ways. I found ChIPseqSpikeInFree package (https://github.com/stjude/ChIPseqSpikeInFree) can estimate scale factors. I wonder if I need to use:

dba(DBA, normalize = SF)

or

dba(DBA, normalize = 1/SF)

The former resulted in no sites and the later resulted in about 8000 sites which look good.

Would you please give me any suggestions?

ADD REPLY
0
Entering edit mode

I'm not sure exactly how ChIPseqSpikeInFree reports its scaling factors.

If you are using DESeq2 method for the analysis, the normalization factors should be lower for "smaller" libraries that need to be upscaled, and have higher values for libraries that need to be downscaled, so 1/SF sounds correct.

You can also use dba.plotMA() to examine the effect on the read counts before and after normalization and verify that it makes sense.

ADD REPLY
0
Entering edit mode

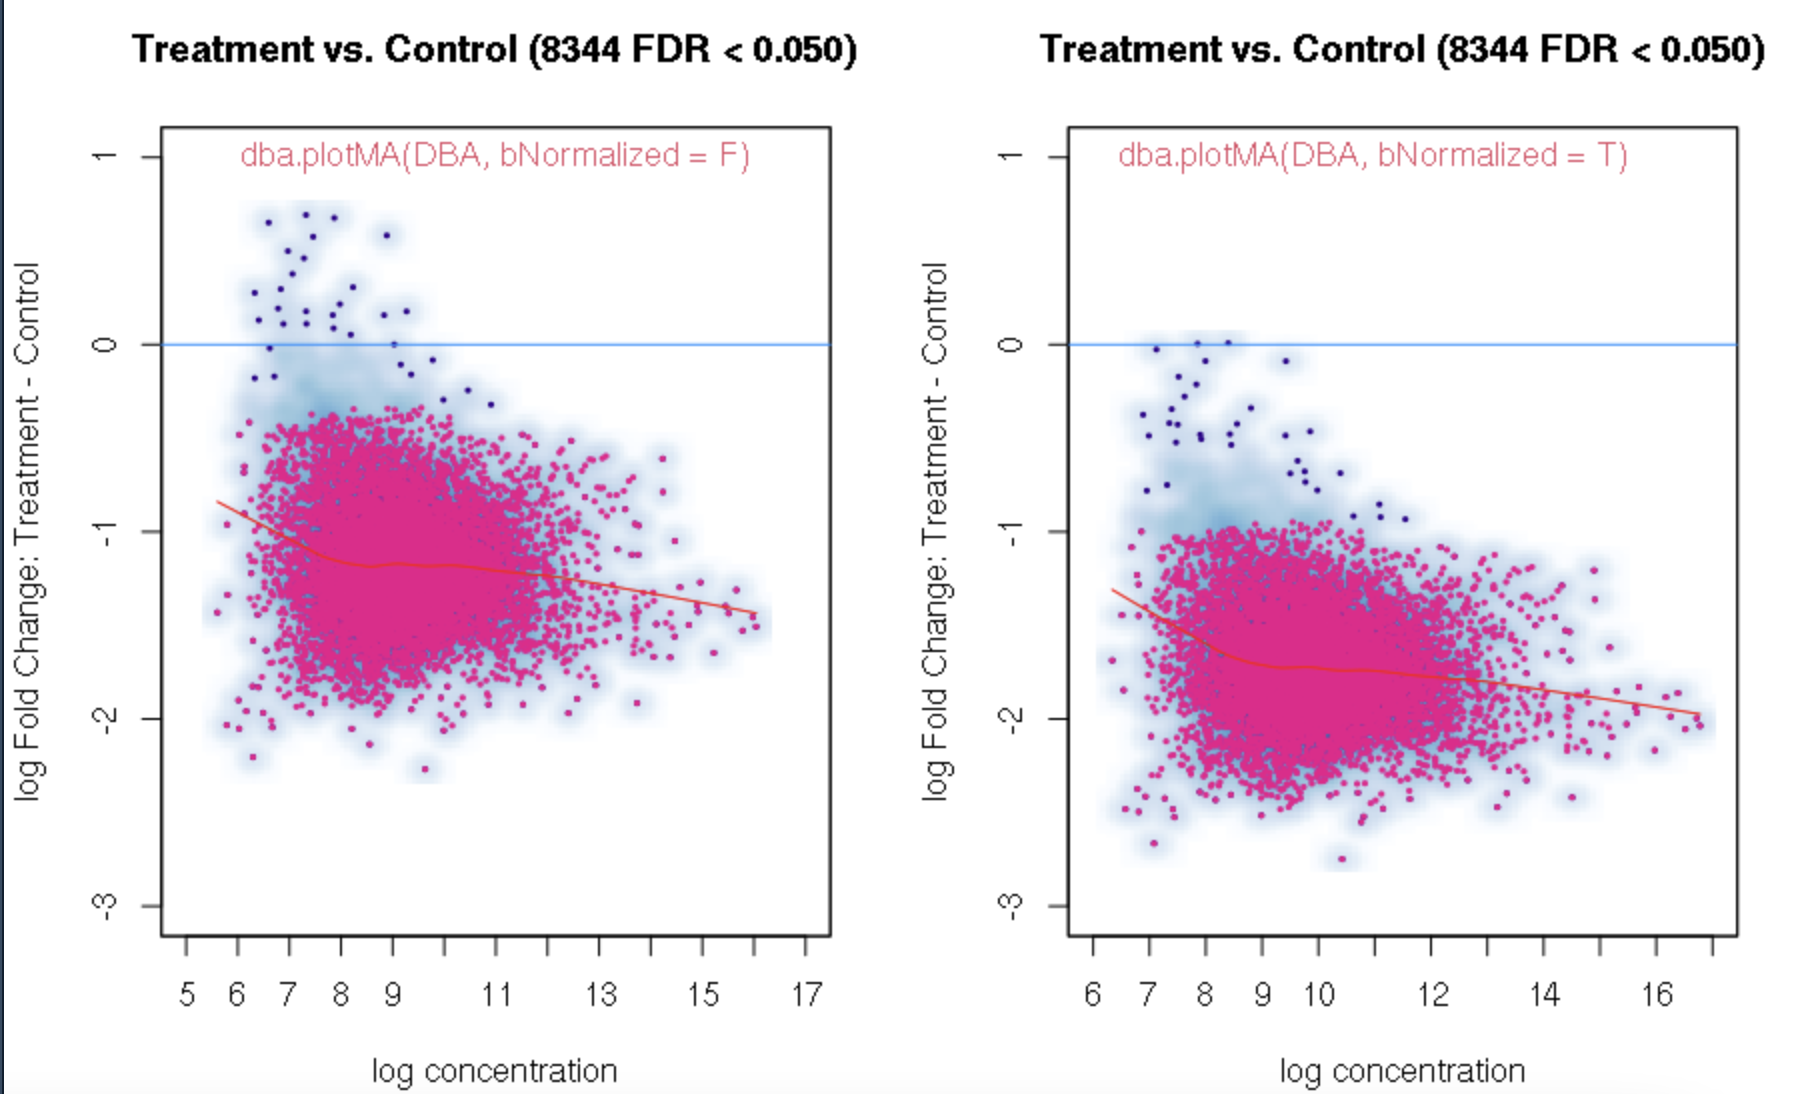
Here are the results of dba(DBA, normalize = 1/SF):

enter image description here

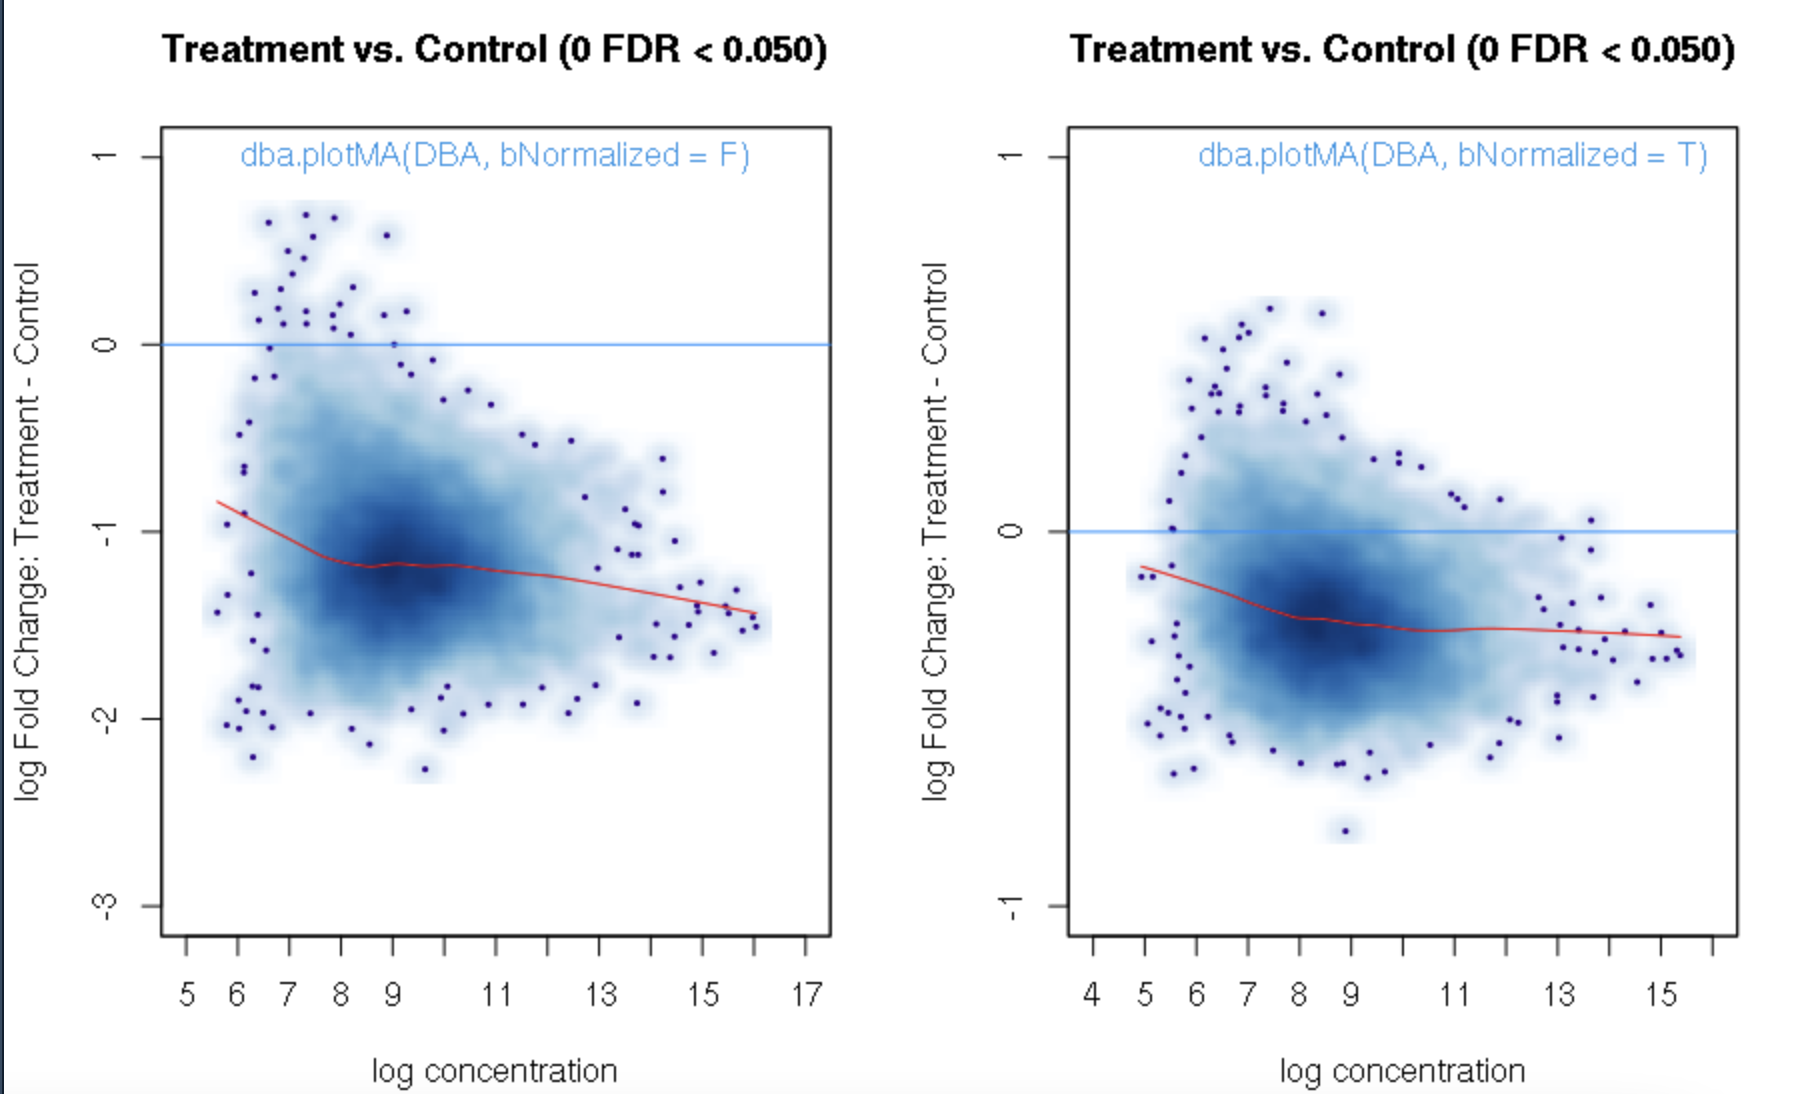
And the results of dba(DBA, normalize = SF): enter image description here

Which method do you think is reasonable?

ADD REPLY
0
Entering edit mode

This really depends on the biology!

The non-normalized data show that the mark you are examining is essentially eliminated by the Treatment (but present in the Control). Is this expected, or is it surprising (or even contrary to expectations)?

The 1/SN normalization confirms and enhances the trend in the raw data that the Treatment inhibits the binding. In sections 7.6 and 7.7 of the Vignette, there is an example very much like this where a treatment inhibits binding.

The SN-based nomalization, on the other hand, tends to decrease the differences (collapsing everything closer to the zero-fold line). This is the type of normalization that would be correct if we're not expecting the binding affinities to change much based on the treatment.

If the replicates are reasonably consistent, then the trend in the raw data should be biologically correct (systematic loss of binding in Treatment condition), and the 1/SN normalization is appropriate.

ADD REPLY
0
Entering edit mode

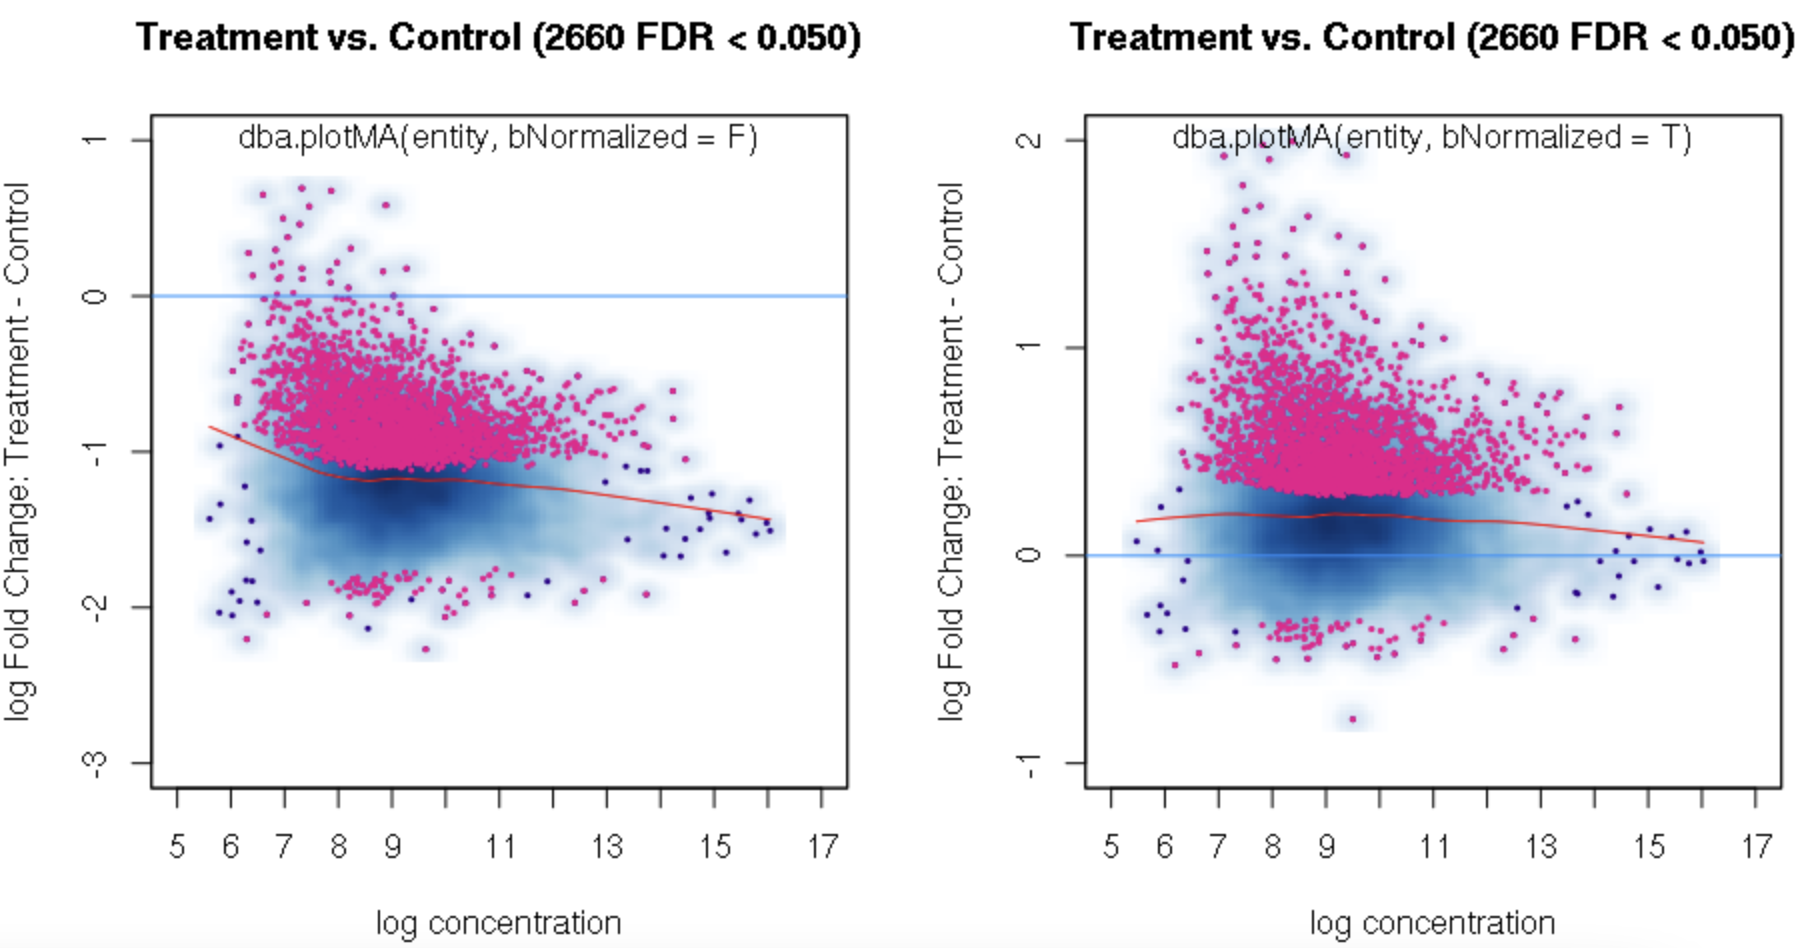
Unfortunately, the treatment is expected to direct, genome-wide upregulation. The result is a big surprising. I asked the author of ChIPseqSpikeInFree. The SF (scale factor) should be used to adjust library sizes. The count is normalized by SF*librarySize. The larger the SF, the greater the loss. So I first used the default library sizes to do normalization and then adjusted the norm.factors using SF. Here is the codes:

entity <- dba.normalize(entity)
norm.facs <- entity$norm$DESeq2$norm.facs * SF
norm.facs <- norm.facs/mean(norm.facs)
entity$norm$DESeq2$norm.facs <- norm.facs
entity <- dba.contrast(entity, minMembers = 2) %>% dba.analyze()

par(mfrow=c(1,2))
dba.plotMA(entity, bNormalized = F)
text(11, 1, labels="dba.plotMA(entity, bNormalized = F)")
dba.plotMA(entity, bNormalized = T)
text(11, 2, labels="dba.plotMA(entity, bNormalized = T)")

enter image description here

Do you think it makes sense?

And I think the lower signals in treatment before normalization may because of lower library size in treatment than in control. There are 2-fold total reads in control than in treatment.

ADD REPLY

Login before adding your answer.

Traffic: 640 users visited in the last hour
Help About
FAQ
Access RSS
API
Stats

Use of this site constitutes acceptance of our User Agreement and Privacy Policy.

Powered by the version 2.3.6