Entering edit mode

Dear community,
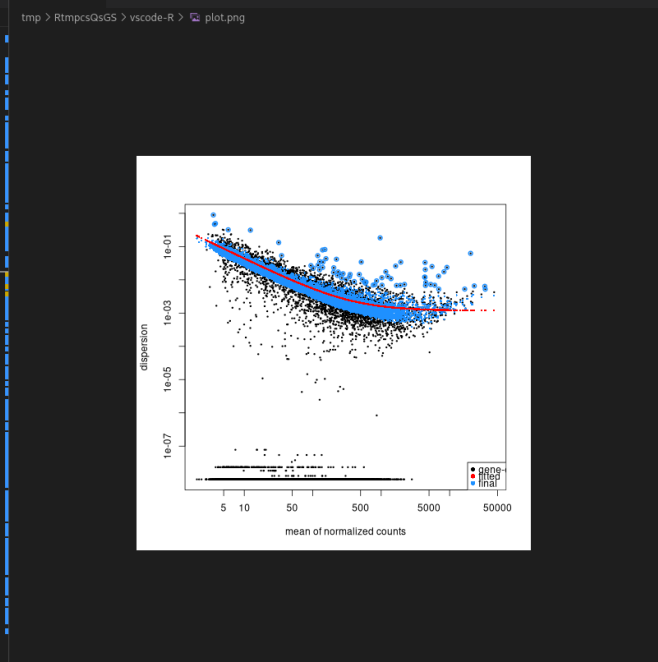
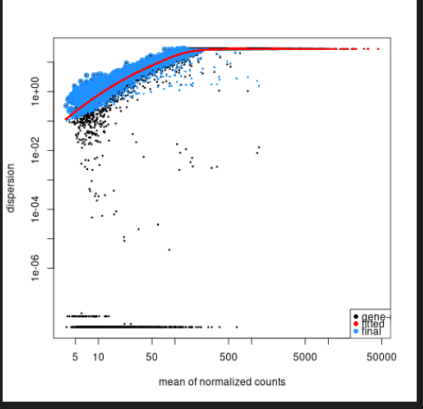
I was using DESeq2 to analyse a small set of data (7 conditions x 4 replicates = 28 samples). I only keep genes that have more than 10 counts in more than 2 samples. Now I got a very strange dispersion plot, almost the opposite of what is expected. The dispersion increases as the count increases. Does anyone know why this is the case? Can I still continue analysing the data as usual or should I adjust something?
Thanks a lot for your input!

Hi Michael,
Thanks for your suggestions and sorry about my late reply. The dataset is a time course of virus infection and the number of viral reads increased as time went by, eventually at 24h about half of the reads came from the virus in the infected samples. However, even if I exclude the samples from 24h the dispersion plot still looks the same. Please find attached a PCA of the raw data without any normalisation. Everything was done in one batch so the conventional "batch effect" should be minimal. In the DESeq2 manual, it says that one should use unnormalised data directly, but do you think I should pre-process the data in any way before I start?
update: I actually found the problem - in my experimental design I forgot to assign effects to one group (mock 0h, 4 samples) even though I didn't include any contrast against this condition, and this somehow messed up the algorithm. After fixing this problem, the dispersion looks good again!