
Hi,
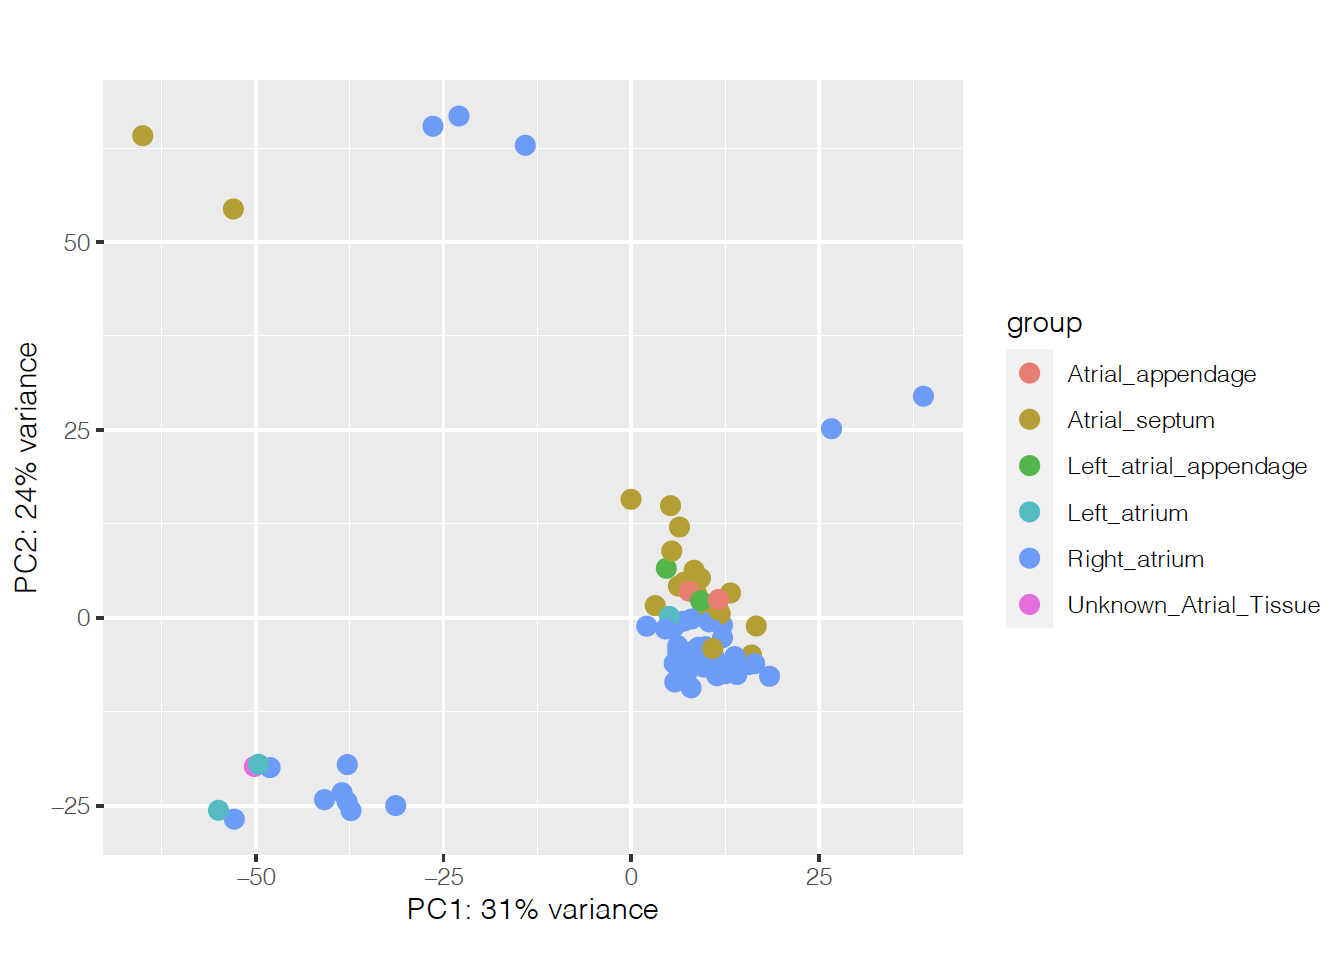
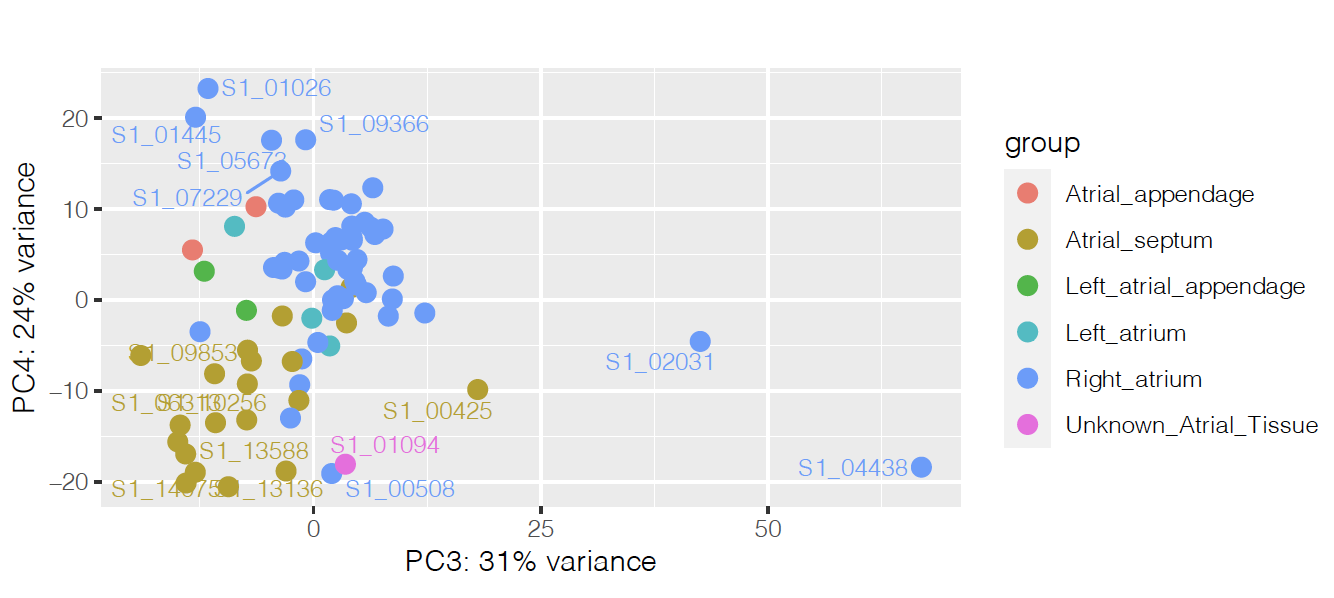
I'm running an analysis with Deseq2 to find differentially expressed genes between two different disease conditions in the heart. It was hard to find what was separating the samples on the PCA, but it seems to be heart region on PCs 3 and 4:
So I'm controlling for that on the design, together with age and ancestry:
design= ~ Sex + Age + Tissue_Location + Condition
I get as result:
out of 53147 with nonzero total read count adjusted p-value < 0.1 LFC > 0 (up) : 2290, 4.3% LFC < 0 (down) : 367, 0.69% outliers 1 : 0, 0% low counts 2 : 23699, 45%
But when I plot the counts of the gene with maximum fold change or smallest p-value, they look like they have very similar counts apart from a couple of outliers:
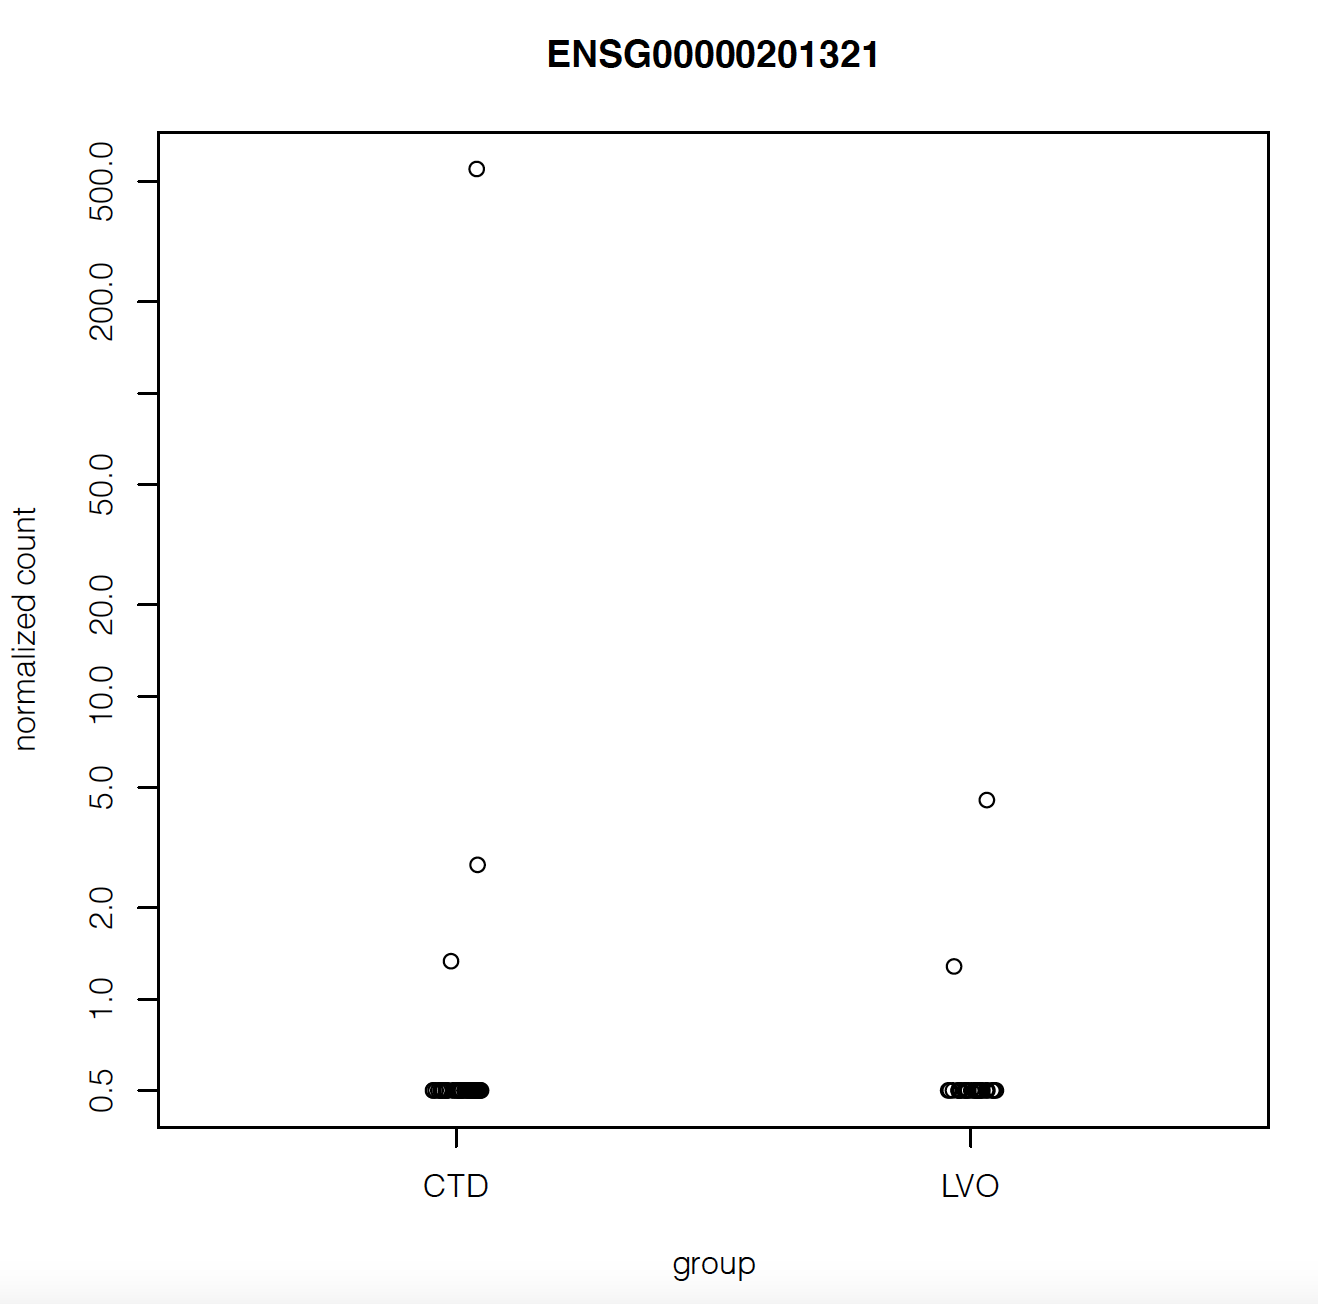
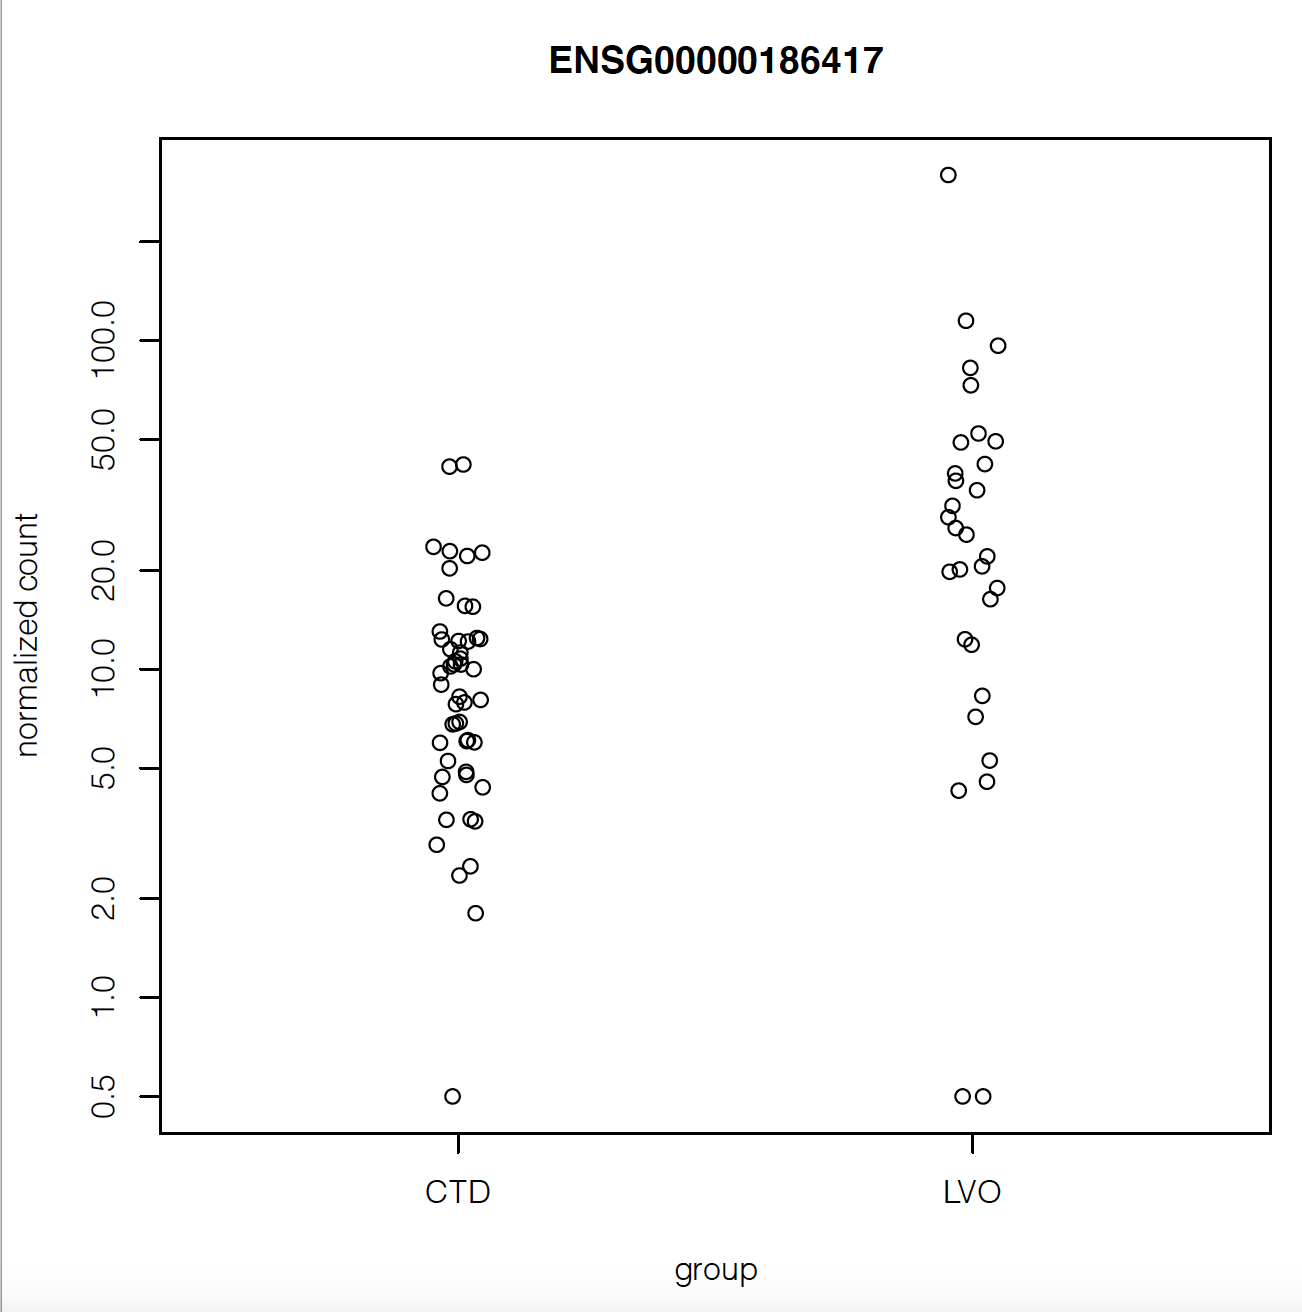
Does that mean there's something wrong with my analysis?
Also the gene with highest fold change has log2FoldChange = 5.8. Isn't that suspiciously high?
sessionInfo( )
R version 4.1.0 (2021-05-18)
Platform: x86_64-pc-linux-gnu (64-bit)
Running under: CentOS Linux 7 (Core)

Matrix products: default
BLAS/LAPACK: /hpc/packages/minerva-centos7/intel/parallel_studio_xe_2019/compilers_and_libraries_2019.0.117/linux/mkl/lib/intel64_lin/libmkl_gf_lp64.so

locale:
 [1] LC_CTYPE=en_US.UTF-8       LC_NUMERIC=C
 [3] LC_TIME=en_US.UTF-8        LC_COLLATE=en_US.UTF-8
 [5] LC_MONETARY=en_US.UTF-8    LC_MESSAGES=en_US.UTF-8
 [7] LC_PAPER=en_US.UTF-8       LC_NAME=C
 [9] LC_ADDRESS=C               LC_TELEPHONE=C
[11] LC_MEASUREMENT=en_US.UTF-8 LC_IDENTIFICATION=C

attached base packages:
[1] parallel  stats4    stats     graphics  grDevices utils     methods
[8] base

other attached packages:
 [1] gplots_3.1.1                ggplot2_3.3.3
 [3] dplyr_1.0.6                 DESeq2_1.32.0
 [5] SummarizedExperiment_1.22.0 Biobase_2.52.0
 [7] MatrixGenerics_1.4.0        matrixStats_0.59.0
 [9] GenomicRanges_1.44.0        GenomeInfoDb_1.28.0
[11] IRanges_2.26.0              S4Vectors_0.30.0
[13] BiocGenerics_0.38.0

loaded via a namespace (and not attached):
 [1] locfit_1.5-9.4         Rcpp_1.0.8.3           lattice_0.20-44
 [4] gtools_3.8.2           png_0.1-7              Biostrings_2.60.1
 [7] assertthat_0.2.1       utf8_1.2.1             R6_2.5.0
[10] RSQLite_2.2.7          httr_1.4.2             pillar_1.6.1
[13] zlibbioc_1.38.0        rlang_0.4.11           rstudioapi_0.13
[16] annotate_1.70.0        blob_1.2.1             Matrix_1.3-4
[19] splines_4.1.0          BiocParallel_1.26.0    geneplotter_1.70.0
[22] RCurl_1.98-1.3         bit_4.0.4              munsell_0.5.0
[25] DelayedArray_0.18.0    compiler_4.1.0         pkgconfig_2.0.3
[28] tidyselect_1.1.1       KEGGREST_1.32.0        tibble_3.1.2
[31] GenomeInfoDbData_1.2.6 XML_3.99-0.6           fansi_0.5.0
[34] withr_2.4.2            crayon_1.4.1           bitops_1.0-7
[37] grid_4.1.0             xtable_1.8-4           gtable_0.3.0
[40] lifecycle_1.0.0        DBI_1.1.1              magrittr_2.0.3
[43] datasets_4.1.0         scales_1.1.1           KernSmooth_2.23-20
[46] cachem_1.0.5           XVector_0.32.0         genefilter_1.74.0
[49] ellipsis_0.3.2         vctrs_0.3.8            generics_0.1.0
[52] RColorBrewer_1.1-2     tools_4.1.0            bit64_4.0.5
[55] glue_1.4.2             purrr_0.3.4            fastmap_1.1.0
[58] survival_3.2-11        AnnotationDbi_1.54.0   colorspace_2.0-1
[61] caTools_1.18.2         memoise_2.0.0
