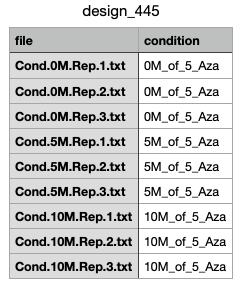
Hello everyone, I'm trying to analyse the RNAseq data, but ate the Contr matrix step the script shows an error, which is: unexpected symbol in "contr_none = makeContrasts(0M_of_5_Aza vs". I have tried all combinations and still don't know how to overcome this problem. I have attached a screenshot of my file called design_445. Maybe the problem is in the computer I'm working on(Mac).
library(limma)
library(RNAseq123)


# Read-in the data:
data = read.table('stud_data_23.txt', header = TRUE, row.names = 1,sep="\t")

rc = as.matrix(data)
class(rc) <- "numeric"
si = design_445
data = DGEList(rc, group=si$condition)

cpm = cpm(data)
lcpm = (cpm(data, log = TRUE))


#Removing genes that are lowly expressed
table(rowSums(data$counts==0)==9)
keep.expr = filterByExpr(data)

data = data[keep.expr,,keep.lib.sizes=FALSE]
dim(data)


#All normalization methods
cpm_none = calcNormFactors(data, method = "none")
cpm_TMM = calcNormFactors(data, method = "TMM")
cpm_TMMwsp = calcNormFactors(data, method = "TMMwsp")
cpm_RLE = calcNormFactors(data, method = "RLE")
cpm_upperquartile = calcNormFactors(data, method = "upperquartile")


#All normalization methods with log data
lcpm_none = cpm(cpm_none, log=TRUE)
lcpm_TMM = cpm(cpm_TMM, log=TRUE)
lcpm_TMMwsp = cpm(cpm_TMMwsp, log=TRUE)
lcpm_RLE = cpm(cpm_RLE, log=TRUE)
lcpm_upperquartile = cpm(cpm_upperquartile, log=TRUE)

#box plots normalized
#NONE
png('box_plot_none.png')
boxplot(lcpm_none, col='green', las=3, main='')
title(main= 'Normalised data, method=none', ylab= 'Log-cpm' )
dev.off()


#TMM
png('box_plot_TMM.png')
boxplot(lcpm_TMM, col='green', las=3, main='')
title(main= 'Normalised data, method=TMM', ylab= 'Log-cpm' )
dev.off()

#TMMwsp
png('box_plot_TMMwsp.png')
boxplot(lcpm_TMMwsp, col='green', las=3, main='')
title(main= 'Normalised data, method=TMMwsp', ylab= 'Log-cpm' )
dev.off()

#RLE
png('box_plot_RLE.png')
boxplot(lcpm_RLE, col='green', las=3, main='')
title(main= 'Normalised data, method=RLE', ylab= 'Log-cpm' )
dev.off()

#upperquartile
png('box_plot_upperquartile.png')
boxplot(lcpm_upperquartile, col='green', las=3, main='')
title(main= 'Normalised data, method=upperquartile', ylab= 'Log-cpm' )
dev.off()


#unsupervised clustering of samples
plotMDS(lcpm_none)
plotMDS(lcpm_TMM)
plotMDS(lcpm_TMMwsp)
plotMDS(lcpm_RLE)
plotMDS(lcpm_upperquartile)


#DGE analysis comparing wild type and mutant samples and show the top 100 DE genes on heatmap for each of normalization methods:
#NONE
design_none = model.matrix(~0 + group, data = cpm_none$samples)
colnames(design_none) = levels(cpm_none$samples$group)

#TMM
design_TMM = model.matrix(~0 + group, data = cpm_TMM$samples)
colnames(design_TMM) = levels(cpm_TMM$samples$group)

#TMMwsp
design_TMMwsp = model.matrix(~0 + group, data = cpm_TMMwsp$samples)
colnames(design_TMMwsp) = levels(cpm_TMMwsp$samples$group)

#RLE
design_RLE = model.matrix(~0 + group, data = cpm_RLE$samples)
colnames(design_RLE) = levels(cpm_RLE$samples$group)

#Upperquartile
design_upperquartile = model.matrix(~0 + group, data = cpm_upperquartile$samples)
colnames(design_upperquartile) = levels(cpm_upperquartile$samples$group)

#Contr Matrix
#NONE
contr_none = makeContrasts(0M_of_5_Aza vs 5M_of_5_Aza = 0M_of_5_Aza - 5M_of_5_Aza, levels = colnames(design_none))


