I want to conduct a differential expression analysis over bulk RNA-seq data, using the limma package. There are several guides for this package, but non of them is helping me get good results, I don't know if I'm doing something wrong or what.
Some functions are not very clear whether I need to use them are not, like DGEList for example (I didn't understnad what do I need it for). Plus, how to build the design & contrast is still unclear for me.
The analysis is between two groups, based on one factor only: Response to treatment vs No Response.
Can someone please suggest the best and most recommended guide? plus, suggestions of which functions should'nt be used, and how to build contrast / design matrices, would be more than welcomed and appreciated.
Thank you.


I used both of these guides, but it didn't work no matter what data I throw to it. I have several data sets, non of them gave good results so the problem is 100% with the code. Here is my code, I wish you could help me
Using this code gives nothing, no significant genes. I tried changing stuff like
model.matrix(~Outcome, group)and tried making the contrast manually withBut didn't work either.
A few things:
I think your gene filtering code is a bit wonky. Instead of your
drop <- which(...)code, try using theedgeR::filterByExpr()function. This will require you to define yourdesignmatrix earlier.Did your voom plot look ok? Ie. is the red trend line you see monotonically decreasing? You haven't showed us your call to
topTable, but aside from my comments above your code looks about right.Regarding your second "shot on goal," ie.
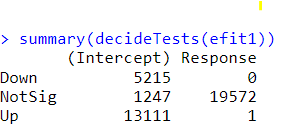
des <- model.matrix(~ Outcome, group), you don't need to setup a contrast, you can just do something like.Hi.. only now I saw that you responded. I tried doing it without contrast as you suggested, but I got similar results :
This is the Voom plot:
And this is after the
eBayesfunction:What do you think ?