I am very much against the idea of removing any outliers that you see on an MDS plot, unless you have some independent information to support the notion that there might be something unusual about those observations. I am not convinced that you have any marked outliers in this case.
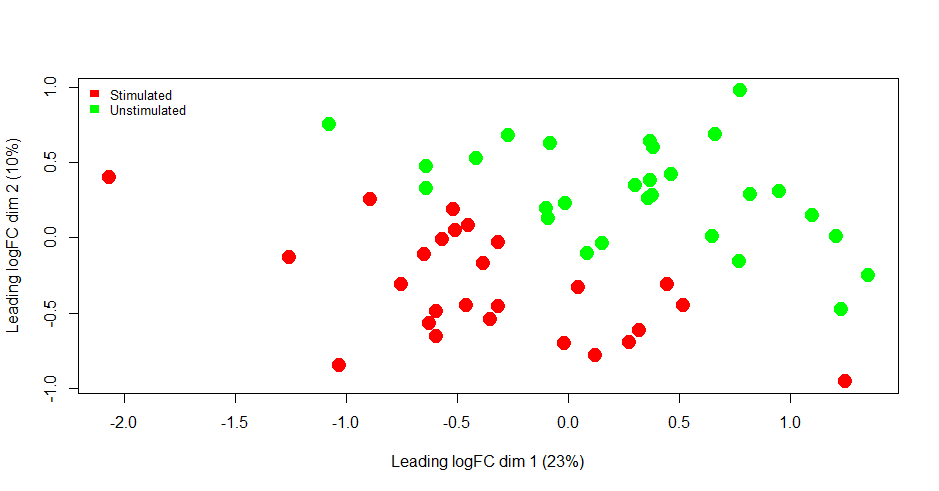
The MDS plot shows a perfect separation between stimulated and unstimulated samples, but with samples also stratified along the first MDS dimension.
The ideal way of dealing with such data would be to identify the sample characteristic associated with the first MDS dimension and include it in the edgeR model. It would ideally be a continuous covariate. If necessary, you can create a surrogate variable to pick up the left to right variation. All samples can stay in the analysis.
Another approach, not quite as good as the first, would be to downweight samples that appear on the far left or right of the plot. To do that, just run edgeR::voomLmFit(dgeObj, design, sample.weights=TRUE) and then use limma to identify the DE genes.
Again you don't remove any samples.
Finally, as a third-best option, you can just do the simple stimulated vs unstimulated analysis on all the samples without any adjustment. I am pretty sure that edgeR will still find plenty of DE genes anyway.
Not the same dataset?
I am assuming that this is not same dataset that you asked about in your previous post Advice on designing an EdgeR object in complex experimental setup ?, because surely you would have said so if it was.
If it was the same dataset, then the first MDS dimension would probably correspond to individual animals and would be already corrected for in the model.