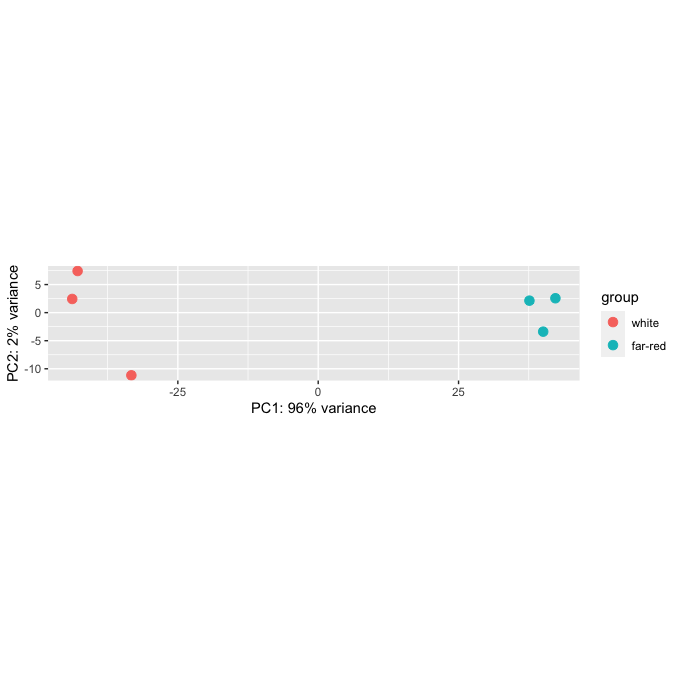
Hi all, I have an error when plotting a PCA graph on R studio. My graph seems to come back where the height dimension is very small making a thin rectangular graph compared to a square. I believe it is due to the scaling on the y and x axis being the same yet PC1 represents 96% variance compared to PC2% representing 2%. Is there a way to change the scaling size within DESeq2:plotPCA without using other programs? I have tried exporting or copying the graph but it still has this issue.
Thanks!

```


The output is ggplot, so yes, you can just add extra config functions with “+ …”
Re the OP question. The coordinate in the plot are actually correct this way. This is giving a fixed aspect ratio. Other plots would be distorted.
Hi there, I did think this afterwards, I am not use to seeing PC1 having such high variability on data! ;-P
Thank you!
Sure, the plot is correct as it is, but if they want it distorted, then it can be done.
(By "fix" I mean "force them to be what you want" not "correct them").