Entering edit mode
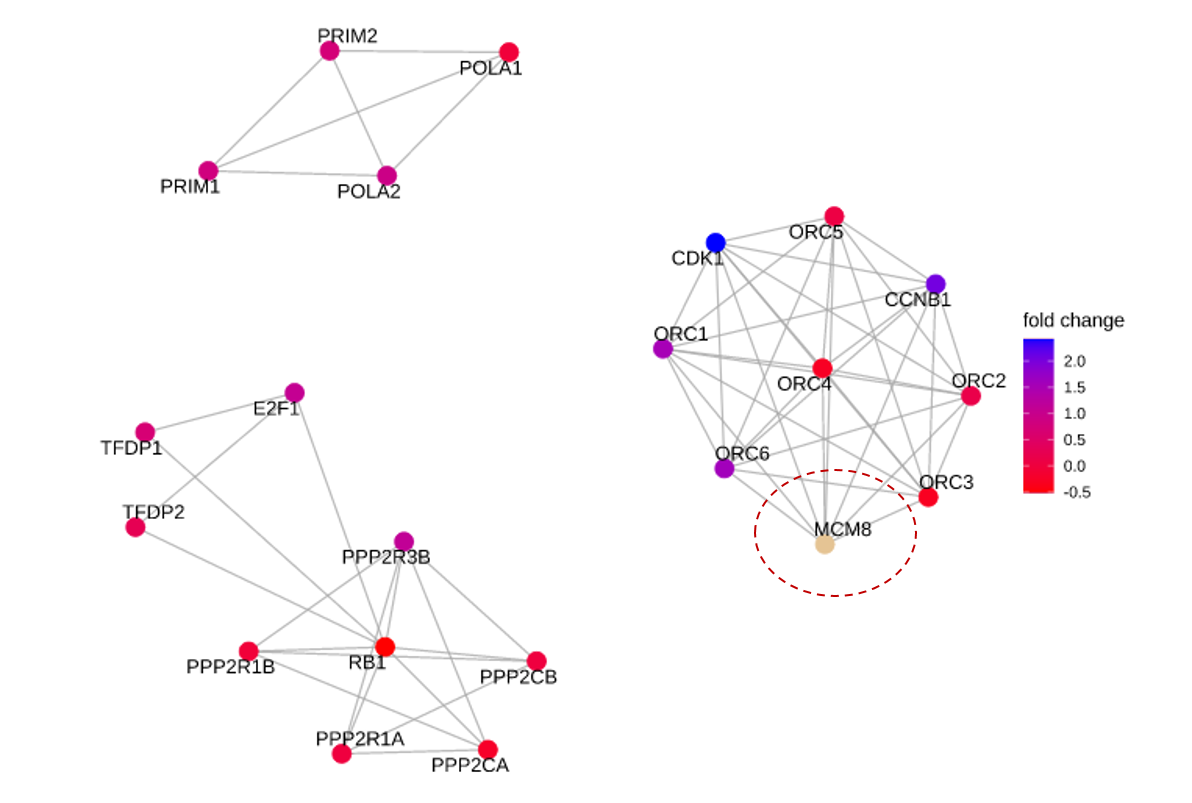
Hi. I understand from the legend of the plot below that the colouration of nodes from red through blue reflects fold change. But what does the node coloured in brown represent?
The figure above is derived from the code below
viewPathway("E2F mediated regulation of DNA replication",
            readable = TRUE,
            foldChange = geneList)


I think this is because MCM8 is absent from the geneList example so there is no FC information