Which Limma guide is recommended ?
2
0
Entering edit mode
JAcky • 0
@d6b8183e
Last seen 2.2 years ago
Israel

I want to conduct a differential expression analysis over bulk RNA-seq data, using the limma package. There are several guides for this package, but non of them is helping me get good results, I don't know if I'm doing something wrong or what.

Some functions are not very clear whether I need to use them are not, like DGEList for example (I didn't understnad what do I need it for). Plus, how to build the design & contrast is still unclear for me.

The analysis is between two groups, based on one factor only: Response to treatment vs No Response.

Can someone please suggest the best and most recommended guide? plus, suggestions of which functions should'nt be used, and how to build contrast / design matrices, would be more than welcomed and appreciated.

Thank you.

limma R DifferentialExpression • 1.5k views
ADD COMMENT
0
Entering edit mode
@gordon-smyth
Last seen 1 day ago
WEHI, Melbourne, Australia

limma comes with a User's Guide, which is the canonical and definitive guide. Just type

limmaUsersGuide()

at the R prompt or find the limma Users Guide online.

The limma authors have also published a tutorial specifically for RNA-seq data ( limma RNA-seq workflow ) and a tutorial specifically on design matrices and contrasts: ( guide to design matrices and contrasts )

A two-group analysis is pretty easy and doesn't even require a contrast matrix.

ADD COMMENT
0
Entering edit mode

I used both of these guides, but it didn't work no matter what data I throw to it. I have several data sets, non of them gave good results so the problem is 100% with the code. Here is my code, I wish you could help me

d0 <- DGEList(counts)
d0 <- calcNormFactors(d0)
cutoff <- 1
drop <- which(apply(cpm(d0), 1, max) < cutoff)
d0 <- d0[-drop,] 

group <- Metadata$Outcome
design <- model.matrix(~0 + Outcome, group)
colnames(design1)[c(1,2)] <- c('NoResponse','Response')

## To the analysis

Voom <- voom(d0, design, plot = TRUE)
vfit <- lmFit(Voom, design) # Fit linear model for each gene
contrast <- makeContrasts(NoResponse-Response, levels=colnames((design)))
vfit  <- contrasts.fit(vfit, contrasts = contrast) # compute statistics and fold changes for comparison interests.
efit <- eBayes(vfit) # computes more precise estimates by sharing gene information using empirical bayes moderation

Using this code gives nothing, no significant genes. I tried changing stuff like model.matrix(~Outcome, group) and tried making the contrast manually with

 contrast <- matrix(c(1 ,0), ncol = 1)
dimnames(contrast) <- list(c('Response', 'NoResponse'), 'Diff')

But didn't work either.

ADD REPLY
0
Entering edit mode

A few things:

I think your gene filtering code is a bit wonky. Instead of your drop <- which(...) code, try using the edgeR::filterByExpr() function. This will require you to define your design matrix earlier.

Did your voom plot look ok? Ie. is the red trend line you see monotonically decreasing? You haven't showed us your call to topTable, but aside from my comments above your code looks about right.

Regarding your second "shot on goal," ie. des <- model.matrix(~ Outcome, group), you don't need to setup a contrast, you can just do something like.

des <- model.matrix(~ Outcome, group)
fit <- lmFit(Voom, des)
fit <- eBayes(fit)
res <- topTable(fit)
ADD REPLY
0
Entering edit mode

Hi.. only now I saw that you responded. I tried doing it without contrast as you suggested, but I got similar results : enter image description here
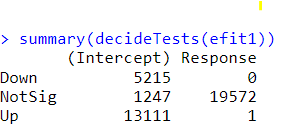
This is the Voom plot:

enter image description here

And this is after the eBayes function:

enter image description here

What do you think ?

ADD REPLY
0
Entering edit mode
JAcky • 0
@d6b8183e
Last seen 2.2 years ago
Israel

Anyone? I've been stuck on this for days. I tried not using DGElist function, and also tried calcNormFactors(d0, method = 'TMM') (don't know if that makes any difference), nothing works. Would it help if I provide a sample of my data ?

ADD COMMENT
0
Entering edit mode

It would help if you would clearly define what the problem is. It appears that you are not getting any differentially expressed genes, which isn't actually a problem with the code, or with either the limma or edgeR packages. But 'nothing works' is an ambiguous term that can be interpreted many ways.

ADD REPLY
0
Entering edit mode

The limma documentation provides several ways to plot and trouble-shoot your data. At very least you should be making the plots shown in the limma workflow paper, especially the MDS plot.

ADD REPLY

Login before adding your answer.

Traffic: 539 users visited in the last hour
Help About
FAQ
Access RSS
API
Stats

Use of this site constitutes acceptance of our User Agreement and Privacy Policy.

Powered by the version 2.3.6