Entering edit mode

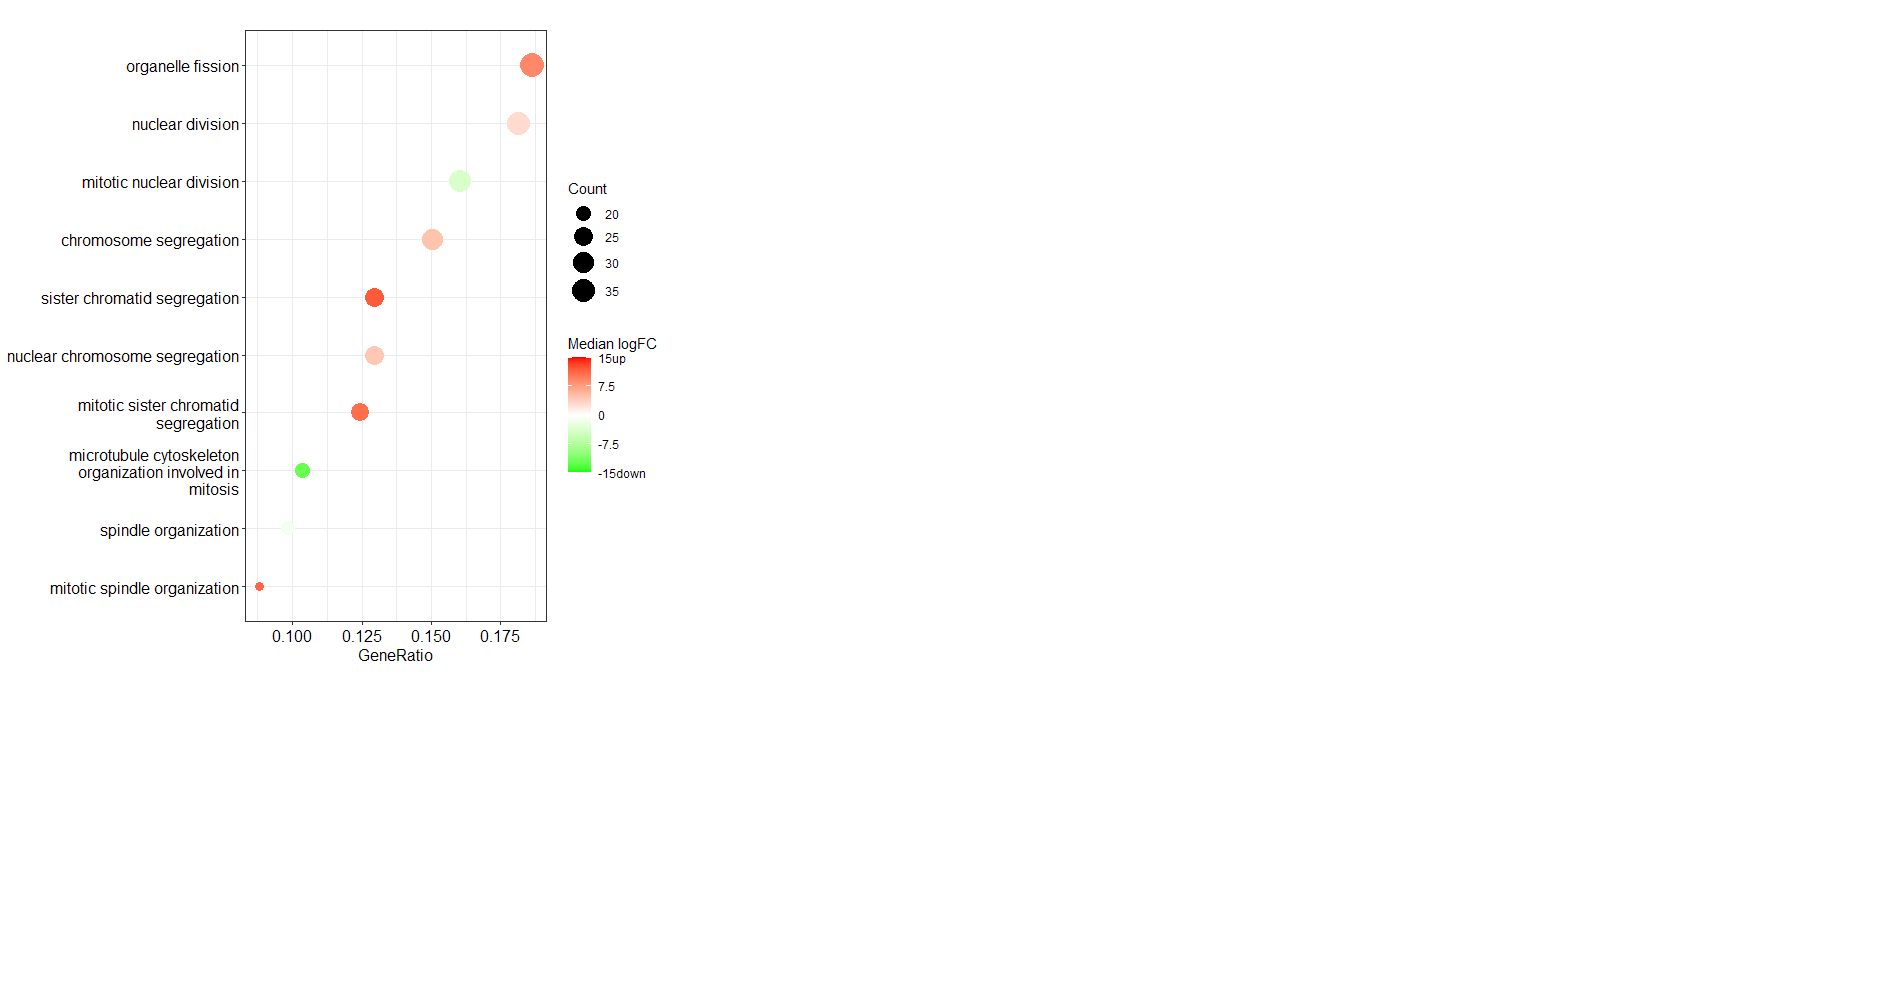
I would like to colour a dotplot of top 20 enriched biological processes by the median fold change of the genes in each category. The fold change of all genes in the enrichment analysis are provided by a separate vector style list that has entrez IDs associated, fold changes are from an experimentally derived dataset. I think this requires some workaround. Thanks in advance for your help!!
My dot plot displays fine but the colour specified by the color = "median(dataFrame_FC)" does not work. It defaults back to p.adjust. I get the following error: Error in match.arg(color, c("pvalue", "p.adjust", "qvalue")) : 'arg' should be one of “pvalue”, “p.adjust”, “qvalue”
# include your problematic code here with any corresponding output

genes = dataframe$EntrezID
foldChange = dataframe$Difference
names(foldChange) = as.character(dataframe$EntrezID)
dataframe_FC = sort(foldChange, decreasing = FALSE)

egoBP <- enrichGO(gene          = genes,
                                  OrgDb         = org.Hs.eg.db,
                                  ont           = "BP",
                                  pAdjustMethod = "BH",
                                  pvalueCutoff  = 0.01,
                                  qvalueCutoff  = 0.05)

  dotplot(
    egoBP,
    x = "GeneRatio",
    color = "median(dataFrame_FC)",
    showCategory = 20,
    size = NULL,
    split = NULL,
    font.size = 12,
    title = "",
    label_format = 30,
  )

sessionInfo(R version 4.0.3 (2020-10-10)
Platform: x86_64-apple-darwin17.0 (64-bit)
Running under: macOS Big Sur 10.16

Matrix products: default
LAPACK: /Library/Frameworks/R.framework/Versions/4.0/Resources/lib/libRlapack.dylib

locale:
[1] en_GB.UTF-8/en_GB.UTF-8/en_GB.UTF-8/C/en_GB.UTF-8/en_GB.UTF-8

attached base packages:
[1] stats4    parallel  stats     graphics  grDevices utils     datasets
[8] methods   base

other attached packages:
 [1] scales_1.1.1           ggupset_0.3.0          tree_1.0-41
 [4] aplot_0.1.3            enrichplot_1.10.2      DOSE_3.16.0
 [7] ggnewscale_0.4.7       clusterProfiler_3.18.1 units_0.8-0
[10] org.Hs.eg.db_3.12.0    AnnotationDbi_1.52.0   IRanges_2.24.1
[13] S4Vectors_0.28.1       Biobase_2.50.0         BiocManager_1.30.16
[16] ExperimentHub_1.16.1   AnnotationHub_2.22.1   BiocFileCache_1.14.0
[19] dbplyr_2.1.1           BiocGenerics_0.36.1    depmap_1.4.0
[22] stringr_1.4.0          gridExtra_2.3          tibble_3.1.6
[25] viridis_0.6.2          viridisLite_0.4.0      ggplot2_3.3.5
[28] dplyr_1.0.8

loaded via a namespace (and not attached):
 [1] fgsea_1.16.0                  colorspace_2.0-3
 [3] ellipsis_0.3.2                rprojroot_2.0.3
 [5] qvalue_2.22.0                 rstudioapi_0.13
 [7] farver_2.1.0                  remotes_2.4.2
 [9] graphlayouts_0.8.0            ggrepel_0.9.1
[11] bit64_4.0.5                   interactiveDisplayBase_1.28.0
[13] fansi_1.0.3                   scatterpie_0.1.7
[15] splines_4.0.3                 cachem_1.0.6
[17] GOSemSim_2.16.1               polyclip_1.10-0
[19] GO.db_3.12.1                  ggforce_0.3.3
[21] shiny_1.7.1                   compiler_4.0.3
[23] httr_1.4.2                    rvcheck_0.2.1
[25] assertthat_0.2.1              Matrix_1.4-1
[27] fastmap_1.1.0                 cli_3.2.0
[29] later_1.3.0                   tweenr_1.0.2
[31] prettyunits_1.1.1             htmltools_0.5.2
[33] tools_4.0.3                   igraph_1.3.0
[35] gtable_0.3.0                  glue_1.6.2
[37] reshape2_1.4.4                DO.db_2.9
[39] rappdirs_0.3.3                fastmatch_1.1-3
[41] Rcpp_1.0.8.3                  vctrs_0.4.1
[43] ggraph_2.0.5                  ps_1.6.0
[45] mime_0.12                     lifecycle_1.0.1
[47] MASS_7.3-56                   tidygraph_1.2.1
[49] promises_1.2.0.1              RColorBrewer_1.1-3
[51] yaml_2.3.5                    curl_4.3.2
[53] memoise_2.0.1                 downloader_0.4
[55] ggfun_0.0.6                   yulab.utils_0.0.4
[57] stringi_1.7.6                 RSQLite_2.2.12
[59] BiocVersion_3.12.0            pkgbuild_1.3.1
[61] BiocParallel_1.24.1           rlang_1.0.2
[63] pkgconfig_2.0.3               lattice_0.20-45
[65] purrr_0.3.4                   patchwork_1.1.1
[67] labeling_0.4.2                processx_3.5.3
[69] cowplot_1.1.1                 shadowtext_0.1.1
[71] bit_4.0.4                     tidyselect_1.1.2
[73] plyr_1.8.7                    magrittr_2.0.3
[75] R6_2.5.1                      generics_0.1.2
[77] DBI_1.1.2                     pillar_1.7.0
[79] withr_2.5.0                   crayon_1.5.1
[81] utf8_1.2.2                    grid_4.0.3
[83] data.table_1.14.2             blob_1.2.3
[85] callr_3.7.0                   digest_0.6.29
[87] xtable_1.8-4                  tidyr_1.2.0
[89] httpuv_1.6.5                  gridGraphics_0.5-1
[91] munsell_0.5.0                 ggplotify_0.1.0  )

Is it possible to get this in RT-qPCR results (fold change as well, meant by 2^ dCt). I am really confused about the utility of cluster profile.
My dataset is made up 55 genes and about 150 samples (twice, pre and post-) Thanks in advance