I am currently running a simple differential gene expression analysis to identify transcriptomic changes between two condition in ~60 patients. This analysis revealed no significantly differentially expressed genes. logFC are symmetrically distributed around 0 and range from -1.5 to 1.5. The adj.P.val ranges from 0.2 to 1 (vast majority is 1).
Nonethless, I decided to run clusterProfiler::GSEA (using hallmark gene sets from msigdb). For that I ranked the all genes according to the logFC that I got from running the differential gene expression analysis. To my surprise, there were plenty of significantly enriched terms (p.val<1e-16). I know this can happen and is also one of the "strengths" of GSEA, because it can detect changes at pathway-level, even if the changes in the expression level of individual genes are not significant, but I did not expect so many enriched pathways.
So I decided to run an additional test and ran differential gene expression analysis between a completely random subset of individuals (disregarding the two initial conditions). The logFC distribution and adj.P.val distribution looked similar to the "real" differential gene expression analsyis (comparing condition A and B). However, again GSEA showed many significantly enriched pathways. This makes me seriously doubt whether I can trust my GSEA results for "real" differential gene expression analysis.
I would greatly appreciate any insights you have on this topic and also maybe an explanation why this can happen and what I can do to prevent it.
EDIT:
Some more informations to illustrate the issue.
Because basically all adj. P values are one, the volcano plot is sort of meaning less.
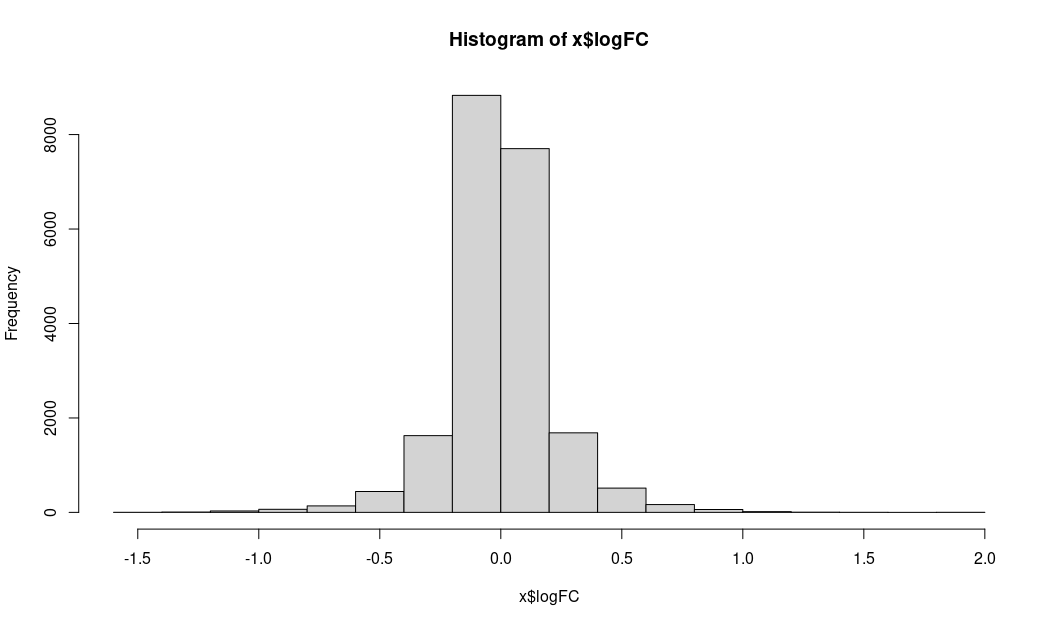
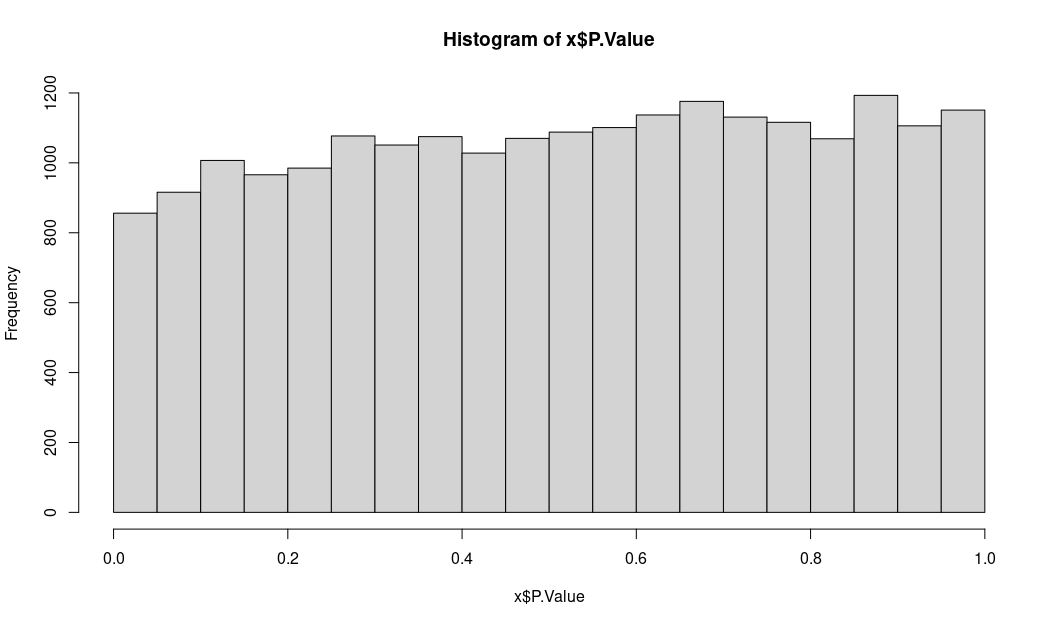
Instead I am showing the distribution of logFC and unadj.P.value
LogFC:
unadjusted P values:
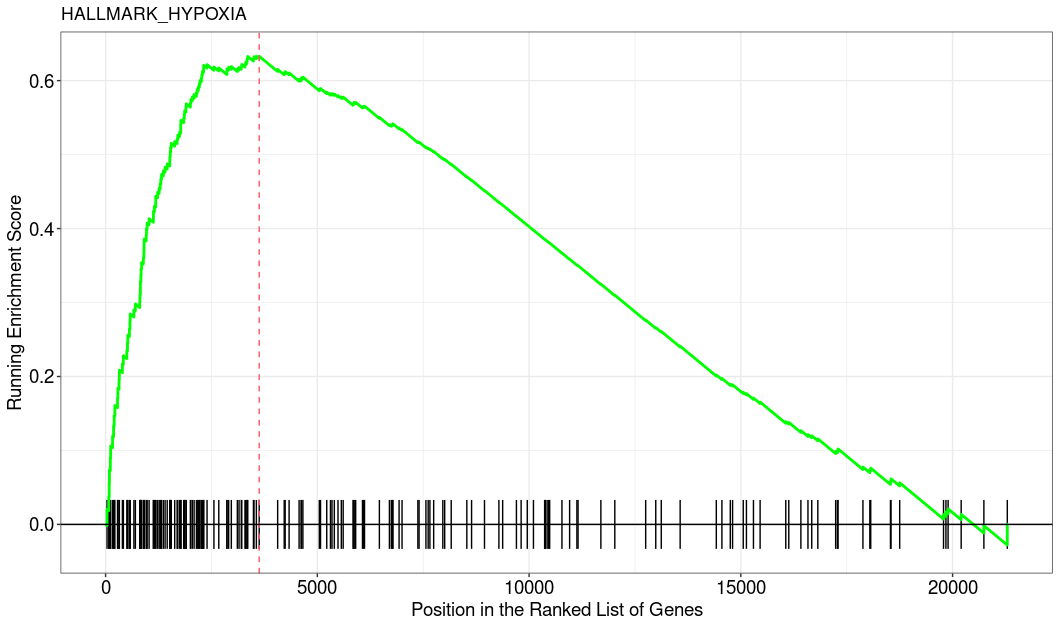
This is how the top enriched pathway looks like. I used the clusterProfiler::GSEA function.


Which GSEA implementation did you use? I mean, GSEA-like analysis is fine to get some pointers but I would always couple it with inspection of the actual fold changes. After all GSEA is fully rank-based and if the individual logFCs that the ranking is based on are tiny then indeed this could indicate that results are statistically significant but biologically meaningless. Can you add some details and plots, e.g. MA-plot and the GSEA enrichment plot of a representative pathway?
Thank you very much for your reply! I have edited my original post.
Looks indeed as I was thinking, the rank-based analysis somehow got significant but the inspection of the actual fold changes clearly indicates that the ranks itself have little to no meaning (imo).