Hi all,
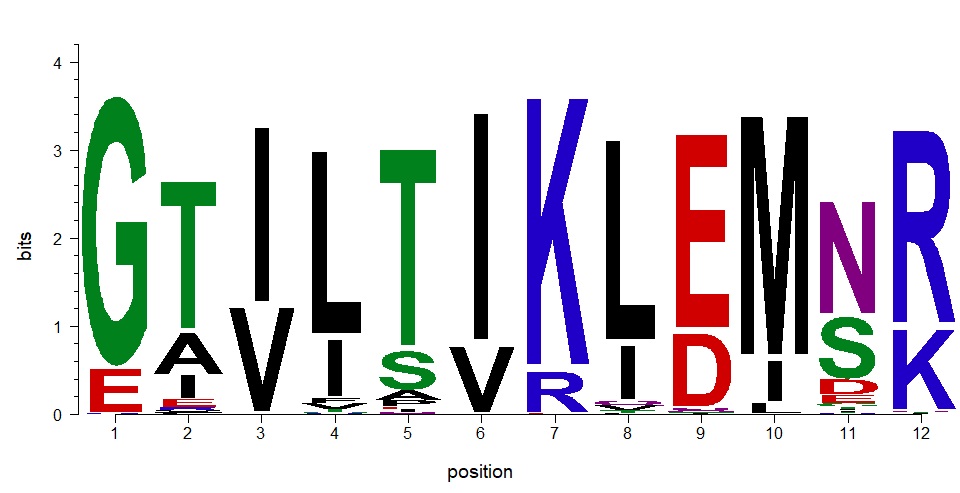
I'm trying to use motifStack R package to plot amino acid specific positions but analysis but I’m facing a problem with the x axis positions’ titles, the numbers are not equal to the position number that I want.
For example, in the photo attached below, the positions are assigned from (1:12) automatically but these are not the positions that I have in my matrix and data sets. How can I change the positions numbers to represents what I want please?
Any help is really appreciated!
motifStack Plotting the correct data positions on x axis
1
Entering edit mode
2
Entering edit mode
It will be available in the coming version. You can try to install the development version via my github now
BiocManager::install("jianhong/motifStack")
To change the x-axis, please try:
plot(motif, xaxis=c('your', 'x-axis', 'here', 'please', 'keep', 'same', 'length', 'as', 'the', 'motif'))
Let me know if you have any trouble.
Jianhong.
Similar Posts
Loading Similar Posts
Traffic: 896 users visited in the last hour
Use of this site constitutes acceptance of our User Agreement and Privacy Policy.


Hi Dr. Jianhong, Thank you very much for your reply, its really appreciated!. I tried the code and it worked perfectly!!! thank you again for doing such amazing package! I also have another issue please, I'm plotting amino acid frequency and I want to change the y label to reflect frequencies from 0 to 100 instead of the default option in the package which is from 0 to 1. Can you please help me with this? Many thanks for your help and efforts. Regards Marwah
Please try to reinstall the development version via the github
And then try:
It is reasonable to change the y-axix as you described. In current stage, I did not have other plan to plot y-axis with user defined values.
Jianhong.
Hi Dr Jianhong, Thank you so much its working now, I really appreciate your help. The Plots looks nice now. Regards Marwah