Filtering Clusterprofiler Result Object
1
@3184ac53
Last seen 2.1 years ago
United States
Hello!
I am running cluster profiler gseGO() function and there are a number of significant GO terms. When I print out the entire list of GO terms I see that many of the significant terms are related to inflammation and fall into similar pathways and categories but there are also unrelated terms. I would like to create a dotplot to visualize specifically these inflammation related terms in one graph. Is it possible to filter the GSEresult object for specific GO terms to put into one graph?
clusterProfiler
• 3.2k views
@guido-hooiveld-2020
Last seen 23 days ago
Wageningen University, Wageningen, the …
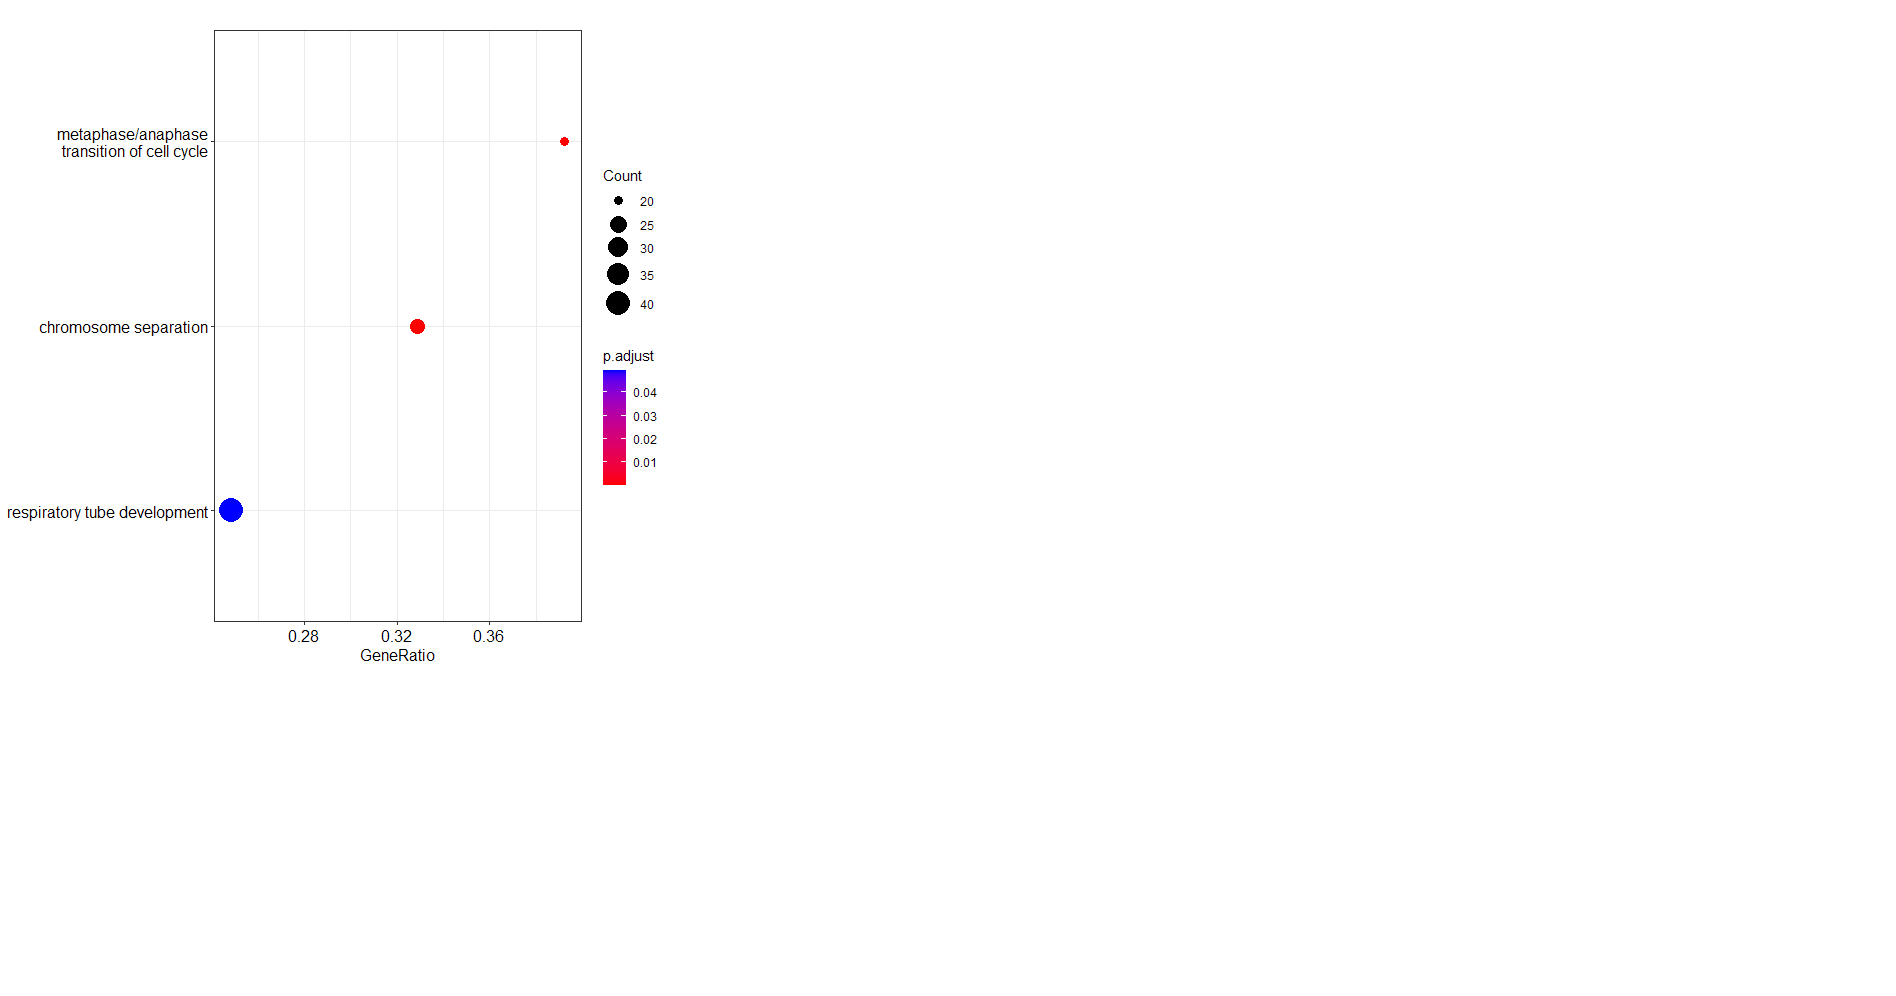
You can make use of the showCategory argument to specify the descriptions of the GO categories you would like to visualize.
> library(clusterProfiler)
> library(DOSE)
> data(geneList)
>
> out.test <- gseGO(geneList, ont = "BP", OrgDb=org.Hs.eg.db, eps=0)
preparing geneSet collections...
GSEA analysis...
leading edge analysis...
done...
>
> # check
> head(as.data.frame(out.test))
                   ID                          Description setSize
GO:0007059 GO:0007059               chromosome segregation     248
GO:0000819 GO:0000819         sister chromatid segregation     156
GO:0000280 GO:0000280                     nuclear division     323
GO:0000070 GO:0000070 mitotic sister chromatid segregation     135
GO:0051301 GO:0051301                        cell division     470
GO:0098813 GO:0098813       nuclear chromosome segregation     200
           enrichmentScore      NES       pvalue     p.adjust      qvalues rank
GO:0007059       0.5963868 2.750921 3.609720e-25 2.093999e-21 1.691249e-21 1374
GO:0000819       0.6721567 2.911727 1.375193e-24 2.659166e-21 2.147714e-21  532
GO:0000280       0.5439154 2.585275 1.041198e-24 2.659166e-21 2.147714e-21 1246
GO:0000070       0.6901685 2.946863 2.251548e-23 3.265307e-20 2.637274e-20  532
GO:0051301       0.4757701 2.324002 4.839659e-23 5.614972e-20 4.535015e-20 1108
GO:0098813       0.6123682 2.765219 1.242271e-22 1.029488e-19 8.314808e-20  449
                             leading_edge
GO:0007059 tags=29%, list=11%, signal=26%
GO:0000819  tags=28%, list=4%, signal=27%
GO:0000280 tags=26%, list=10%, signal=24%
GO:0000070  tags=30%, list=4%, signal=29%
GO:0051301  tags=21%, list=9%, signal=20%
GO:0098813  tags=22%, list=4%, signal=22%
                                                                                                                                                                                                                                                                                                                                                                                                                                                                                                                                          core_enrichment
GO:0007059                                                                                                                                          55143/991/9493/1062/10403/7153/23397/9787/11065/55355/220134/51203/10460/4751/55839/4085/81930/81620/332/7272/64151/9212/9319/9055/3833/146909/891/24137/9232/9928/11004/990/5347/29127/26255/701/11130/57405/10615/1894/79075/9700/898/11339/4288/9134/2237/9918/699/1063/26271/55055/54892/79980/9735/23310/292/10051/1104/5359/83990/5885/2072/84722/51115/7283/80010/51647/54908/10592/6732/54069
GO:0000819                                                                                                                                                                                                                                                                                                         55143/991/9493/1062/10403/7153/23397/9787/11065/51203/10460/4751/4085/81930/81620/7272/64151/9212/9319/9055/3833/146909/891/24137/9232/9928/11004/990/5347/29127/26255/701/11130/10615/79075/9700/2237/9918/699/1063/26271/55055/54892
GO:0000280                                                                          55143/991/9493/1062/4605/9133/10403/7153/23397/259266/9787/11065/51203/22974/10460/4751/10635/27338/4085/81930/81620/3832/7272/64151/9212/1111/9319/9055/3833/146909/6790/891/24137/9232/9928/1164/11004/4603/990/5347/29127/26255/701/11130/10615/79075/8438/9700/5888/898/56992/4288/9134/2175/91646/994/9918/699/1063/26271/55055/54892/5902/79980/9585/9735/23310/2253/8877/9088/995/10051/79703/1104/79866/83990/5885/11200/2072/940/1761/84722/51115/7283/80010
GO:0000070                                                                                                                                                                                                                                                                                                                   55143/991/9493/1062/10403/23397/9787/11065/51203/10460/4751/4085/81930/81620/7272/64151/9212/9319/9055/3833/146909/891/24137/9232/9928/11004/990/5347/29127/26255/701/11130/10615/79075/9700/9918/699/1063/26271/55055/54892
GO:0051301 55143/991/9493/1062/9133/10403/7153/23397/79733/259266/55165/11065/220134/51203/83461/22974/10460/4751/27338/890/983/54821/4085/5080/81620/332/3832/64151/9212/9055/3833/146909/10112/6790/891/24137/9232/9928/1164/11004/993/990/5347/29127/701/11130/57405/10615/1894/9700/898/23594/11339/3070/10733/1163/54801/9134/29899/54962/994/9918/1058/54478/699/4609/1063/26271/55055/641/8872/5898/3925/54892/4904/29901/8317/79980/9585/9735/10907/2810/23310/5499/2253/55726/8607/995/10051/1104/84790/1019/79866/83990/5885/11200/10263/203068
GO:0098813                                                                                                                                                                                                                                                                                                 55143/991/9493/1062/10403/7153/23397/9787/11065/51203/10460/4751/4085/81930/81620/7272/64151/9212/9319/9055/3833/146909/891/24137/9232/9928/11004/990/5347/29127/26255/701/11130/10615/1894/79075/9700/898/9134/2237/9918/699/1063/26271/55055
>
> # Using three random descriptions
> dotplot(out.test,
+    showCategory=c("chromosome separation", "respiratory tube development", "metaphase/anaphase transition of cell cycle")  )
>
>
>
before adding your answer.
Traffic: 680 users visited in the last hour


