Entering edit mode
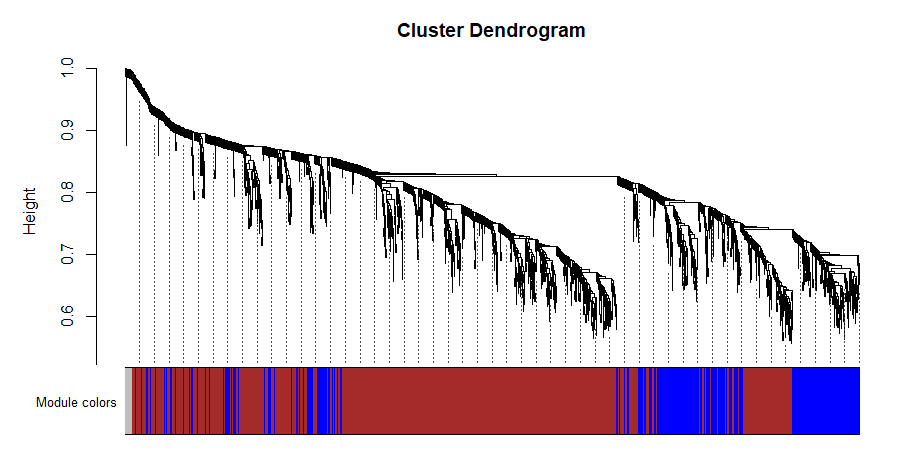
I am trying to plot my gene dendrogram while following the online tutorials for WGCNA. When using the function "table(bwnet$colors)" it shows that there should be 24 modules for my data. When I continue running the code for plotting the dendrogram (code below) I somehow keep getting a plot that looks like this. It seems to me that this is not consistent with there being 24 modules.
bwnet = blockwiseModules(datExpr0, maxBlockSize = 2000,
                     power = 6, TOMType = "unsigned", minModuleSize = 30,
                     reassignThreshold = 0, mergeCutHeight = 0.25,
                     numericLabels = TRUE,
                     saveTOMs = TRUE,
                     saveTOMFileBase = "TOM-blockwise",
                     verbose = 3)


# open a graphics window
sizeGrWindow(12, 9)
# Convert labels to colors for plotting
mergedColors = labels2colors(bwnet$colors)
# Plot the dendrogram and the module colors underneath
plotDendroAndColors(bwnet$dendrograms[[1]], mergedColors[bwnet$blockGenes[[1]]],
                    "Module colors",
                    dendroLabels = FALSE, hang = 0.03,
                    addGuide = TRUE, guideHang = 0.05)

table(bwnet$colors)


![> 0    1    2    3    4    5    6    7    8    9   10   11   12   13   14   15   16   17   18   19   20   21   22
1287 4001 3115 2498 1774 1706 1135  735  484  305  299  269  265  157  117  111  104  101   77   71   68   63   61
  23   24
  60   44][1]


Hello,
I think we have the same problem, have you figured it out?