Entering edit mode

Hi all,
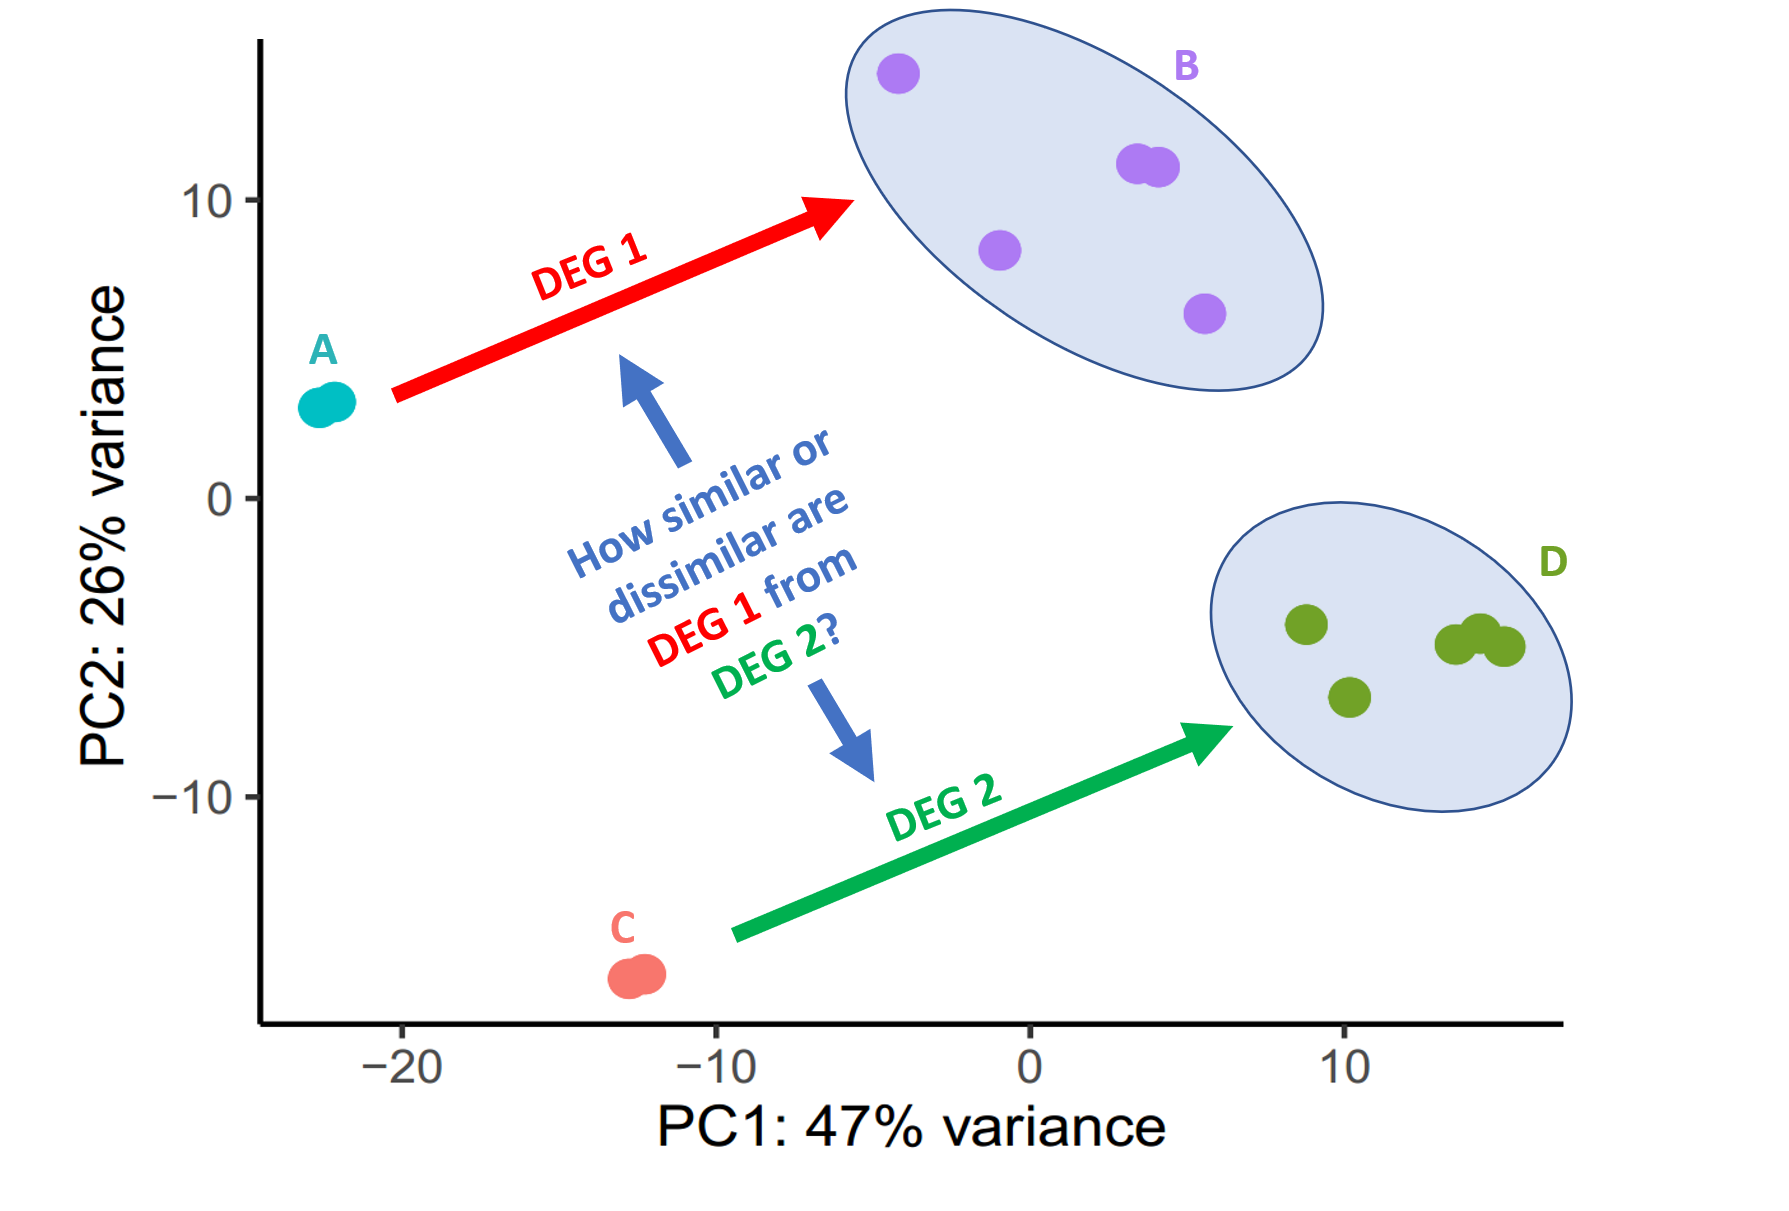
I have two cell types, (A) a cell line and (B) a primary cell. I then added the same stimulus on them and sequenced their RNA. My goal is to show that even though their not the same cells, they react similar to the stimulus. I have ploted the PCA of the expression matrix where the untrated (A and C) and the stimulated (B and D) are plotted seperately. Is there a statistical way to asses the similarities of the differentially expressed datasets (DEG1 and DEG2) and plot them in a selfexplanatory way? I've used DESeq2 for my analysis.
Thanks!

Agree with ATpoint, I would prefer to look at a correlation of shrunken LFC. This is actually what it was designed for.