I have a bulk RNAseq dataset of over 50 samples that has been sequenced in 2 batches. I want to run Deseq2 eventually and I am exploring the data for potential outliers and covariates to include into the model. For initial exploratory purposes I run the following code:
dds <- DESeqDataSetFromMatrix(countData = counts, colData = design, design = ~ batch)
dds <- estimateSizeFactors(dds)
vsd <- vst(dds)
rld <- rlog(dds)
pcaData <- plotPCA(vst, intgroup=batch, returnData=TRUE)
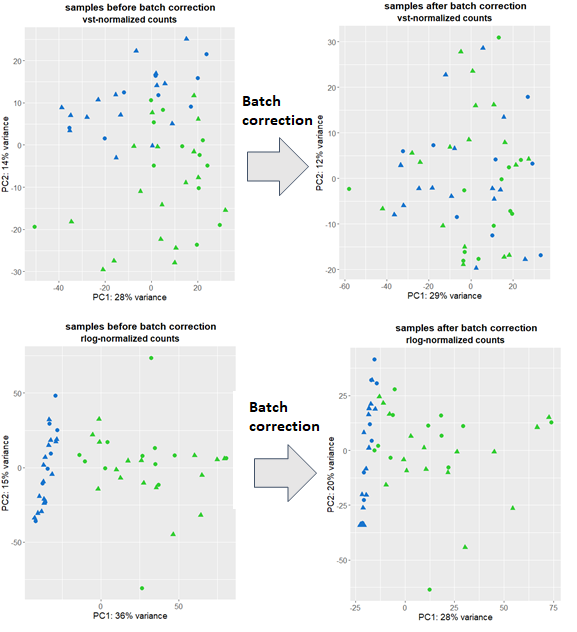
and plot using ggplot. I have a couple of outliers which I remove and repeat the procedure above with the remaining data. I am puzzled since I get 2 pretty different pictures showing I have smaller or bigger batch effects (depending on the transformation used) depicted by blue/green:
I then use Combat-seq to correct for batch effects and run the above code again followed by plotting. vst-transformed data clearly shows that the batch effects were removed, however, rlog points to still persistent batch effects.
Which plot should I believe and how should I proceed further when constructing the Deseq2 model: assume that there are no batch effects or include it as a covariate in the GLM?
Thank you.


Thanks a lot for a swift reply.
Does modeling of the batch in Deseq2 have a limitation? i.e. if the batch effects look big on the PCA plot as in rlog plot one would rather go for a more aggressive batch correction method like Combat-seq and model batch effects if they are mild?
Since I would like to use my data for downstream (machine learning) applications besides DEG analysis (where I need to have batch effects removed), would you suggest believing the output of vst over rlog regarding the success of batch correction or do I need to perform additional analysis/visualization using other transformations?
No downside I know of to modeling in the design formula.
See our vignette on some code to remove batch associated variance from VST data for downstream applications like PCA.