How to obtain summary statistics for all Bioc releases
3
1
Entering edit mode
Robert Ivanek ▴ 750
@robert-ivanek-5892
Last seen 13 months ago
Switzerland

Dear all,

Is there a way to fetch summary statistics (programmatically) of all Bioc releases?

* date of release 

* number of packages

* number of packages in biocViews (optionally)

Unfortunately the information is not available on the release page (or not completely) https://bioconductor.org/about/release-announcements/

Thanks

Robert

bioconductor release • 2.0k views
ADD COMMENT
2
Entering edit mode
@wolfgang-huber-3550
Last seen 3 months ago
EMBL European Molecular Biology Laborat…

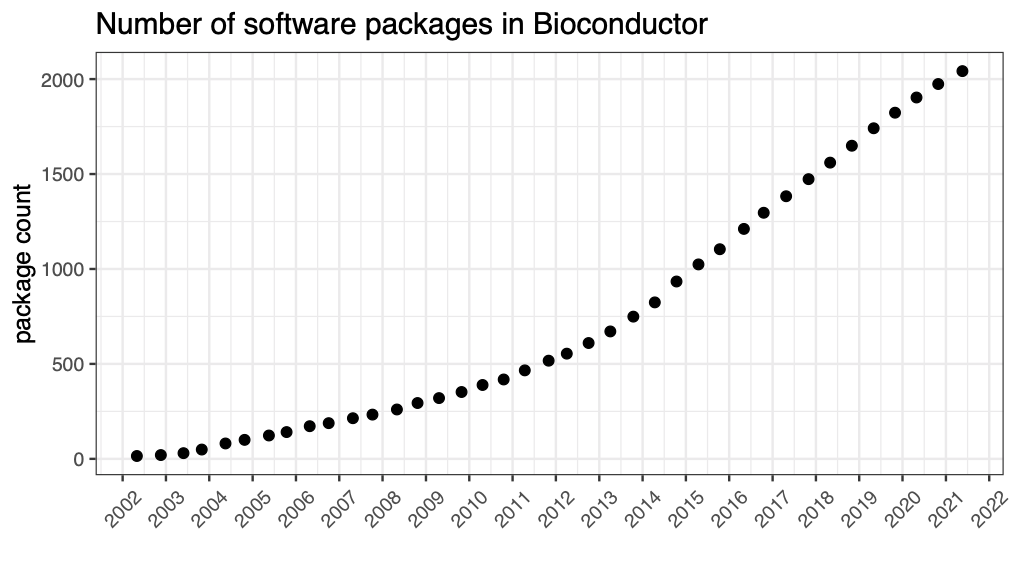
FWIW, here's an updated version of Pete's code using Lori's additions to the Bioconductor site:

library("rvest")
library("ggplot2")
library("magrittr")
library("dplyr")

bioc_pkgs = read_html("http://bioconductor.org/about/release-announcements")
bioc_pkgs_tbl = html_nodes(bioc_pkgs, "table")[[1]] |> html_table()

Sys.setlocale(locale = "en_US.UTF-8")
bioc_pkgs_tbl %<>% mutate(rdate = as.Date(Date, "%b %d, %Y"))

ggplot(bioc_pkgs_tbl, aes(x = rdate, y = `Software packages`)) + 
  scale_x_date(date_breaks = "1 year", date_labels = "%Y") + 
  xlab("") + ylab("package count") +
  geom_point(size = 2.5) + 
  ggtitle("Number of software packages in Bioconductor") + 
  theme_bw(base_size = 14) + 
  theme(axis.text.x = element_text(angle = 45, vjust = 0.5))

dev.copy(pdf, file = "BiocNumberPackages.pdf", width = 8, height = 4.5); dev.off()

number of Bioconductor packages

ADD COMMENT
1
Entering edit mode
@martin-morgan-1513
Last seen 4 months ago
United States

Table 2 of the annual report includes number of packages for each release; there have always been two (spring / fall) releases, but dates before are not readily available (?)

http://bioconductor.org/packages/bioc/1.5/src/contrib/PACKAGES and forward are 'dcf' files produced by the last build of each release -- read.dcf(url("http...")).

http://bioconductor.org/packages/1.8/bioc/VIEWS and forward contain more information, including biocViews terms (biocViews were introduced in June, 2005, I think).

More information about release dates might be obtained by scraping the svn log at https://hedgehog.fhcrc.org/bioconductor/trunk/madman/Rpacks and from the mailing list archives https://hypatia.math.ethz.ch/pipermail/bioconductor and bioc-devel ; the bioconductor mailing list was transferred to the support site, so some creative googling e.g, site:support.bioconductor.org "release date" may lead to additional information, e.g., Release 1.4 information ; I also had success with the support site search engine "release 1.1", etc.

I'm not really sure what you mean by 'views' (maybe biocViews, available from the VIEWS file?); there are download statistics at bioc_pkg_stats.tab available from http://bioconductor.org/packages/stats/ since Jan, 2009.

If you do uncover links to release-like announcements, dates, and other information that could be added to the release-announcements page feel free to post a pull request to https://github.com/Bioconductor/support.bioconductor.org

ADD COMMENT
1
Entering edit mode

Also not a programmatic solution, but at each release we post the release date and number of packages on the Bioconductor Wikipedia page

ADD REPLY
0
Entering edit mode

Dear Martin and Peter,

Thanks a lot for your helpful answers. 

Best, Robert


ADD REPLY
1
Entering edit mode
Peter Hickey ▴ 740
@petehaitch
Last seen 8 weeks ago
WEHI, Melbourne, Australia

Sharing my reply to Robert's email; he asked for the data behind a post I wrote that included a graph of number of packages per release (http://blog.revolutionanalytics.com/2015/08/a-short-introduction-to-bioconductor.html). The post is from a few releases back, but I've updated the code.

The data come from the Bioconductor Wikipedia article. Below is the code I wrote to scrap and plot it. Please feel free to use with attribution.

library(rvest)
library(ggplot2)
bioc_pkgs <- read_html("https://en.wikipedia.org/wiki/Bioconductor")
bioc_pkgs_tbl <- html_nodes(bioc_pkgs, "table")[[2]] %>%
  html_table()
# A kludge to get version numbers properly ordered
bioc_pkgs_tbl$Version[bioc_pkgs_tbl$Version == 1] <- "1.0"
bioc_pkgs_tbl$Version[bioc_pkgs_tbl$Version == 2] <- "2.0"
bioc_pkgs_tbl$Version[bioc_pkgs_tbl$Version == 3] <- "3.0"
bioc_pkgs_tbl$Version[bioc_pkgs_tbl$Version == 2.1] <- c("2.1", "2.10")
bioc_pkgs_tbl$Version <- factor(
    bioc_pkgs_tbl$Version,
    levels = unique(bioc_pkgs_tbl$Version))
ggplot(aes(x = Version, y = `Package Count`), data = bioc_pkgs_tbl) + 
  geom_point(size = 3.5) + 
  ggtitle("Number of software packages in Bioconductor releases") + 
  theme_bw(base_size = 14) + 
  theme(axis.text.x = element_text(angle = 45, vjust = 0.5))

ADD COMMENT
1
Entering edit mode

I am adding the package count statistics and older versions of BioC/R that appear on the wikipedia page to the release announcement webpage so it will be available in both locations. It should be updated within the hour.

ADD REPLY

Login before adding your answer.

Traffic: 421 users visited in the last hour
Help About
FAQ
Access RSS
API
Stats

Use of this site constitutes acceptance of our User Agreement and Privacy Policy.

Powered by the version 2.3.6