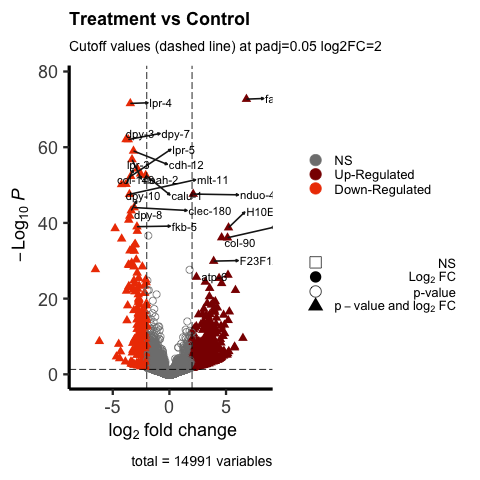
Currently using EnhancedVolcano in R studio. Using the vignette I was able to generate a volcano plot. I have included an image to this post of my current volcano plot.
I am interested in wanting to label only the DEGs that have greater than -log10P=40. I would like them to be clearly visible and not clustered near each other as they are in my image. I understand the warning sign I am receiving due to many genes near one another.
What code would be needed to display clearly only the DEGs that have greater than -log10P=40? Should I do this in selectLab? or label separately using geom_label_repel? The hard way would be to label each gene name in selectLab... I'm just hoping for an easier way to do this.
Thank you for your help. -robledoj13
Code should be placed in three backticks as shown below
png("VolcanoPlot_4.png")
keyvals <- ifelse(de1_symbols$log2FoldChange < -2, 'orangered2', ifelse(de1_symbols$log2FoldChange > 2, 'red4', 'grey50'))
    keyvals[is.na(keyvals)] <- 'grey50'
    names(keyvals)[keyvals == 'orangered2'] <- 'Down-Regulated'
    names(keyvals)[keyvals == 'grey50'] <- 'NS'
    names(keyvals)[keyvals == 'red4'] <- 'Up-Regulated'
    EnhancedVolcano(de1_symbols, lab = rownames(de1_symbols), x = 'log2FoldChange', y = 'padj', selectLab = rownames(de1_symbols)[which(names(keyvals) %in% c('Down-Regulated', 'Up-Regulated'))], xlab = bquote(~log[2]~ 'fold change'), title = 'G-G+ vs G-G-', pCutoff = 0.05, subtitle = 'Cutoff values (dashed line) at padj=0.05 log2FC=2', FCcutoff = 2, pointSize = 3.0, labSize = 4, shape = c(0, 16, 1, 17), colCustom = keyvals, colAlpha = 1, legendPosition = 'right', legendLabSize = 13, legendIconSize = 5.0, drawConnectors = TRUE, widthConnectors = 0.75, gridlines.major = FALSE, gridlines.minor = FALSE, border = 'partial', borderWidth = 1.5, borderColour = 'black')
    dev.off()
Warning message:
ggrepel: 527 unlabeled data points (too many overlaps). Consider increasing max.overlaps

sessionInfo( )


