
Hello, I've been analysing RNAseq samples to identify differentially expressed genes (DEG) using DESeq2. I have 6 samples, 3 treated/3 control and a batch effect caused by the day the experiments were performed. Briefly, this is the design of the experiment :
Sample   Treatment    BatchEffect
  S1      Control          A
  S2      Control          B
  S3      Control          C
  S4      Treated          A
  S5      Treated          B
  S6      Treated          C
I've accounted for the batch effect in DESeq2 using design = ~ BatchEffect + Treatment and I found several DEG, so no problem here. On top of that, I also wanted to assess the quality of the data and the impact of the batch effect removal using sample to sample distances, amongst other things (as adviced in DESeq2 vignette). The batch effect removal (I used limma::removeBatchEffect) is pretty efficient because it clusters the samples by condition and reduce the distances between them. However, after removing the batch effect, I noticed that the sample to sample distances are the same between conditions. Here's an example of distance heatmaps before and after batch correction :
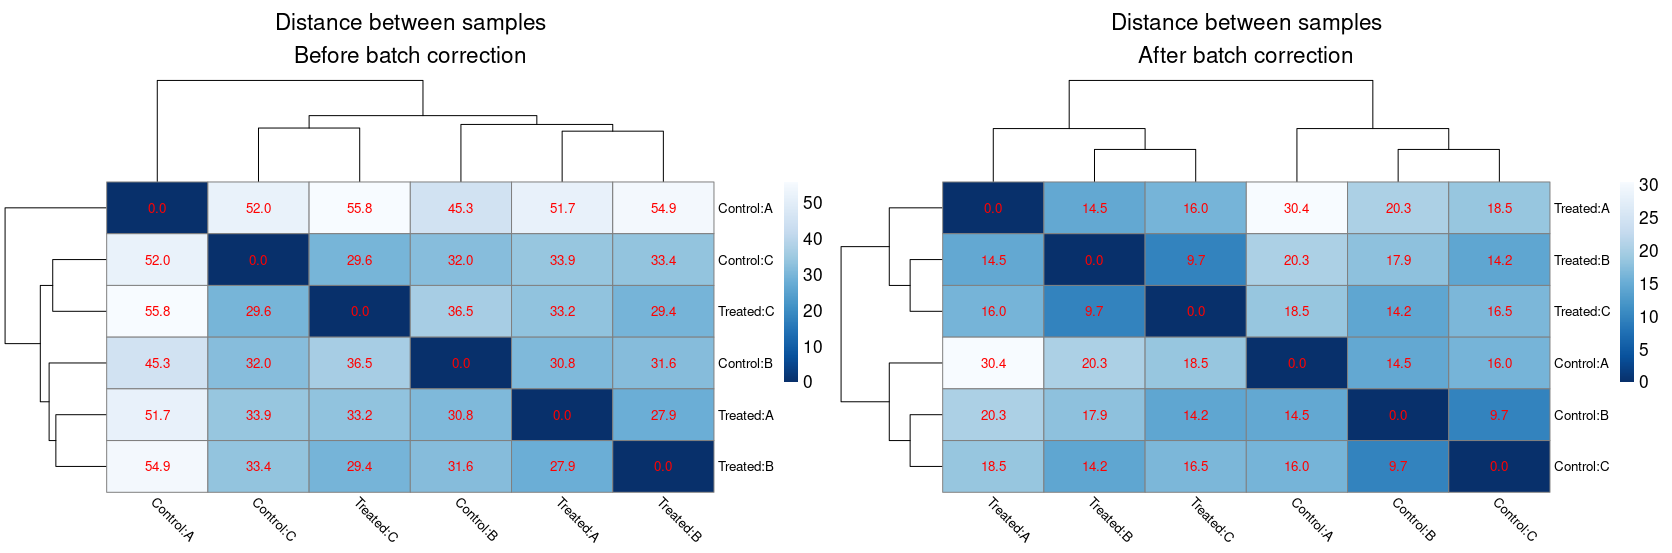
For example, the distance between Treated:A and Treated:B is the same than between Control:A and Control:B. This experiment was performed in 10 species and the "identical distances" happened everytime. Is it an intended feature of batch effect removal ? If not, what could explain this behaviour ?
Here's the code I used (after running DESeqDataSetFromMatrix() and DESeq() commands) :
# Applies variance stabilization
blind_vst <- varianceStabilizingTransformation(dds, blind = T, fitType = "local")
non_blind_vst <- varianceStabilizingTransformation(dds, blind = F, fitType = "local")

# Removes batch effect
mat <- assay(non_blind_vst)
model_mat <- model.matrix(formula(paste("~ ",Treatment)), colData(non_blind_vst))
mat <- limma::removeBatchEffect(x = mat, batch = non_blind_vst[[Treatment]], design = model_mat)
assay(non_blind_vst) <- mat

# Sample to sample distance heatmap without batch effect correction
## Extracts distance data for the plot
sample_dist <- dist(t(assay(blind_vst)))
sample_dist_mat <- as.matrix(sample_dist)
## Makes the plot
rownames(sample_dist_mat) <- paste(blind_vst[[condition]],blind_vst[[batch]], sep = ':')
colnames(sample_dist_mat) <- paste(blind_vst[[condition]],blind_vst[[batch]], sep = ':')
pheatmap(mat = sample_dist_mat, color = colorRampPalette(rev(brewer.pal(9,"Blues")))(255),
          clustering_distance_rows = sample_dist, clustering_distance_cols = sample_dist,
          border_color = "grey50", treeheight_row = 75, treeheight_col = 75,
          legend = T, show_rownames = T, show_colnames = T,
          main = bquote(atop("Distance between samples in"~italic(.(assembly)),
                             "Before batch correction")),
          fontsize = 13, fontsize_row = 10, fontsize_col = 10, angle_col = 315,
          display_numbers = T, number_format = "%.1f", number_color = "red", fontsize_number = 10,
          na_col = "grey", silent = F)

# Sample to sample distance heatmap with batch effect correction
## Extracts distance data for the plot
sample_dist_cor <- dist(t(assay(non_blind_vst)))
sample_dist_mat_cor <- as.matrix(sample_dist_cor)
## Makes the plot
rownames(sample_dist_mat_cor) <- paste(non_blind_vst[[condition]],non_blind_vst[[batch]], sep = ':')
colnames(sample_dist_mat_cor) <- paste(non_blind_vst[[condition]],non_blind_vst[[batch]], sep = ':')
pheatmap(mat = sample_dist_mat_cor, color = colorRampPalette(rev(brewer.pal(9,"Blues")))(255),
         clustering_distance_rows = sample_dist_cor, clustering_distance_cols = sample_dist_cor,
         border_color = "grey50", treeheight_row = 75, treeheight_col = 75,
         legend = T, show_rownames = T, show_colnames = T,
         main = bquote(atop("Distance between samples in"~italic(.(assembly)),
                            "After batch correction")),
         fontsize = 13, fontsize_row = 10, fontsize_col = 10, angle_col = 315,
         display_numbers = T, number_format = "%.1f", number_color = "red", fontsize_number = 10,
         na_col = "grey", silent = F)
And here's the result of sessionInfo() :
R version 4.0.3 (2020-10-10)
Platform: x86_64-pc-linux-gnu (64-bit)
Running under: Ubuntu 20.04.2 LTS

Matrix products: default
BLAS:   /usr/lib/x86_64-linux-gnu/blas/libblas.so.3.9.0
LAPACK: /usr/lib/x86_64-linux-gnu/lapack/liblapack.so.3.9.0

locale:
 [1] LC_CTYPE=en_US.UTF-8       LC_NUMERIC=C               LC_TIME=fr_FR.UTF-8        LC_COLLATE=en_US.UTF-8     LC_MONETARY=fr_FR.UTF-8
 [6] LC_MESSAGES=en_US.UTF-8    LC_PAPER=fr_FR.UTF-8       LC_NAME=C                  LC_ADDRESS=C               LC_TELEPHONE=C
[11] LC_MEASUREMENT=fr_FR.UTF-8 LC_IDENTIFICATION=C

attached base packages:
[1] parallel  stats4    stats     graphics  grDevices utils     datasets  methods   base

other attached packages:
 [1] scales_1.1.1                RColorBrewer_1.1-2          pheatmap_1.0.12             limma_3.44.3
 [5] ggrepel_0.9.1               ggplot2_3.3.3               IHW_1.16.0                  DESeq2_1.28.1
 [9] SummarizedExperiment_1.18.2 DelayedArray_0.14.1         matrixStats_0.59.0          Biobase_2.48.0
[13] GenomicRanges_1.40.0        GenomeInfoDb_1.24.2         IRanges_2.22.2              S4Vectors_0.26.1
[17] BiocGenerics_0.34.0         data.table_1.14.0           apeglm_1.10.0

loaded via a namespace (and not attached):
 [1] bit64_4.0.5            splines_4.0.3          blob_1.2.1             GenomeInfoDbData_1.2.3 slam_0.1-48
 [6] numDeriv_2016.8-1.1    pillar_1.6.1           RSQLite_2.2.7          lattice_0.20-44        glue_1.4.2
[11] bbmle_1.0.23.1         XVector_0.28.0         colorspace_2.0-1       Matrix_1.3-4           plyr_1.8.6
[16] XML_3.99-0.6           pkgconfig_2.0.3        emdbook_1.3.12         genefilter_1.70.0      zlibbioc_1.34.0
[21] purrr_0.3.4            xtable_1.8-4           mvtnorm_1.1-1          fdrtool_1.2.16         BiocParallel_1.22.0
[26] tibble_3.1.2           annotate_1.66.0        generics_0.1.0         ellipsis_0.3.2         cachem_1.0.5
[31] withr_2.4.2            survival_3.2-11        magrittr_2.0.1         crayon_1.4.1           memoise_2.0.0
[36] fansi_0.5.0            MASS_7.3-54            tools_4.0.3            lifecycle_1.0.0        munsell_0.5.0
[41] locfit_1.5-9.4         AnnotationDbi_1.50.3   compiler_4.0.3         rlang_0.4.11           grid_4.0.3
[46] RCurl_1.98-1.3         bitops_1.0-7           gtable_0.3.0           DBI_1.1.1              R6_2.5.0
[51] dplyr_1.0.6            bdsmatrix_1.3-4        fastmap_1.1.0          bit_4.0.4              utf8_1.2.1
[56] lpsymphony_1.16.0      Rcpp_1.0.6             vctrs_0.3.8            geneplotter_1.66.0     tidyselect_1.1.1
[61] coda_0.19-4
Thanks in advance for your help !

Alright, so nothing to worry about, then, I guess ?
Thank you very much for your answer !
Hi Mike, I have a related issue where I'm seeing (post-batch correction) identical gene counts across different donors (that pertain to a single condition), despite having specified to adjust for the donor variable as a batch covariate using
limma::removeBatchEffect.Given my Donor / Group split below (I have multiple samples belonging to different treatments etc. for Group B, but I'm only interested in correcting counts across donors for visualization) - I'm basically seeing all the Group A Donor's getting identical counts after using the function (for a given gene), and the rest adjusted
This is what happens when you remove donor variation.