Hello,
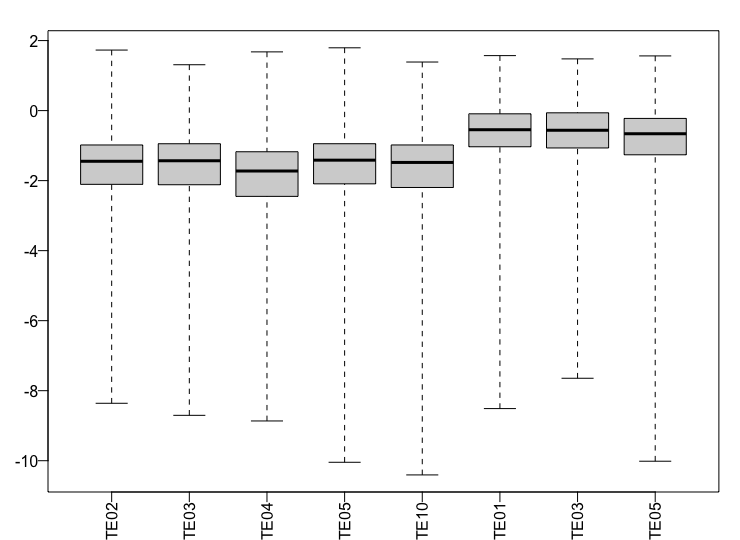
I''m working with natural population with expected higher within group variance in gene expression. In the figure below, the first 5 samples belong to species 1 and the last 3 samples belong to species 2.
Here, I see the samples of species 2 all have a higher value of cook's distance when compared to species 1 samples. The summary of the results function is as follows:
out of 13647 with nonzero total read count
adjusted p-value < 0.05
LFC > 0 (up)       : 956, 7%
LFC < 0 (down)     : 416, 3%
outliers [1]       : 631, 4.6%
low counts [2]     : 1058, 7.8%
So, I am observing some hundreds of outliers. I was wondering what would be the best way to move forward?
Thanks in advance


Thank you very much. I filtered the data as above. I have one question. I have a hybrid between two species and in this case, the outliers might be interesting since the ovaries in hybrids are malfunctional. I was wondering how I could extract the reported outliers from the results table? Thanks again!
See vignette section on "Access to all calculated values".
See vignette section on "Access to all calculated values".
Really great, thank you!