I am analyzing an RNA-seq experiment in which I compare a control library (high coverage) with a treatment one (low coverage). There is some sample-specific length bias across samples and I am trying to correct this with the EDASeq package.
data <- newSeqExpressionSet(counts=as.matrix(reads[keep,]),
                            featureData=featureData,
                            phenoData=data.frame(
                                    conditions=conds,
                                    row.names=colnames(reads)))

dataOffset <- withinLaneNormalization(data,"length", which="full",offset=TRUE)
dataOffset <- betweenLaneNormalization(dataOffset, which="full",offset=TRUE)
After normalization, I do DGE analysis with edgeR:
a <- DGEList(counts=counts(dataOffset), group=conds, genes=as.character(rownames(reads[keep,])))
a$offset <- -offst(dataOffset)
a <- estimateDisp(a, design)
fit <- glmQLFit(a,design,robust=TRUE)
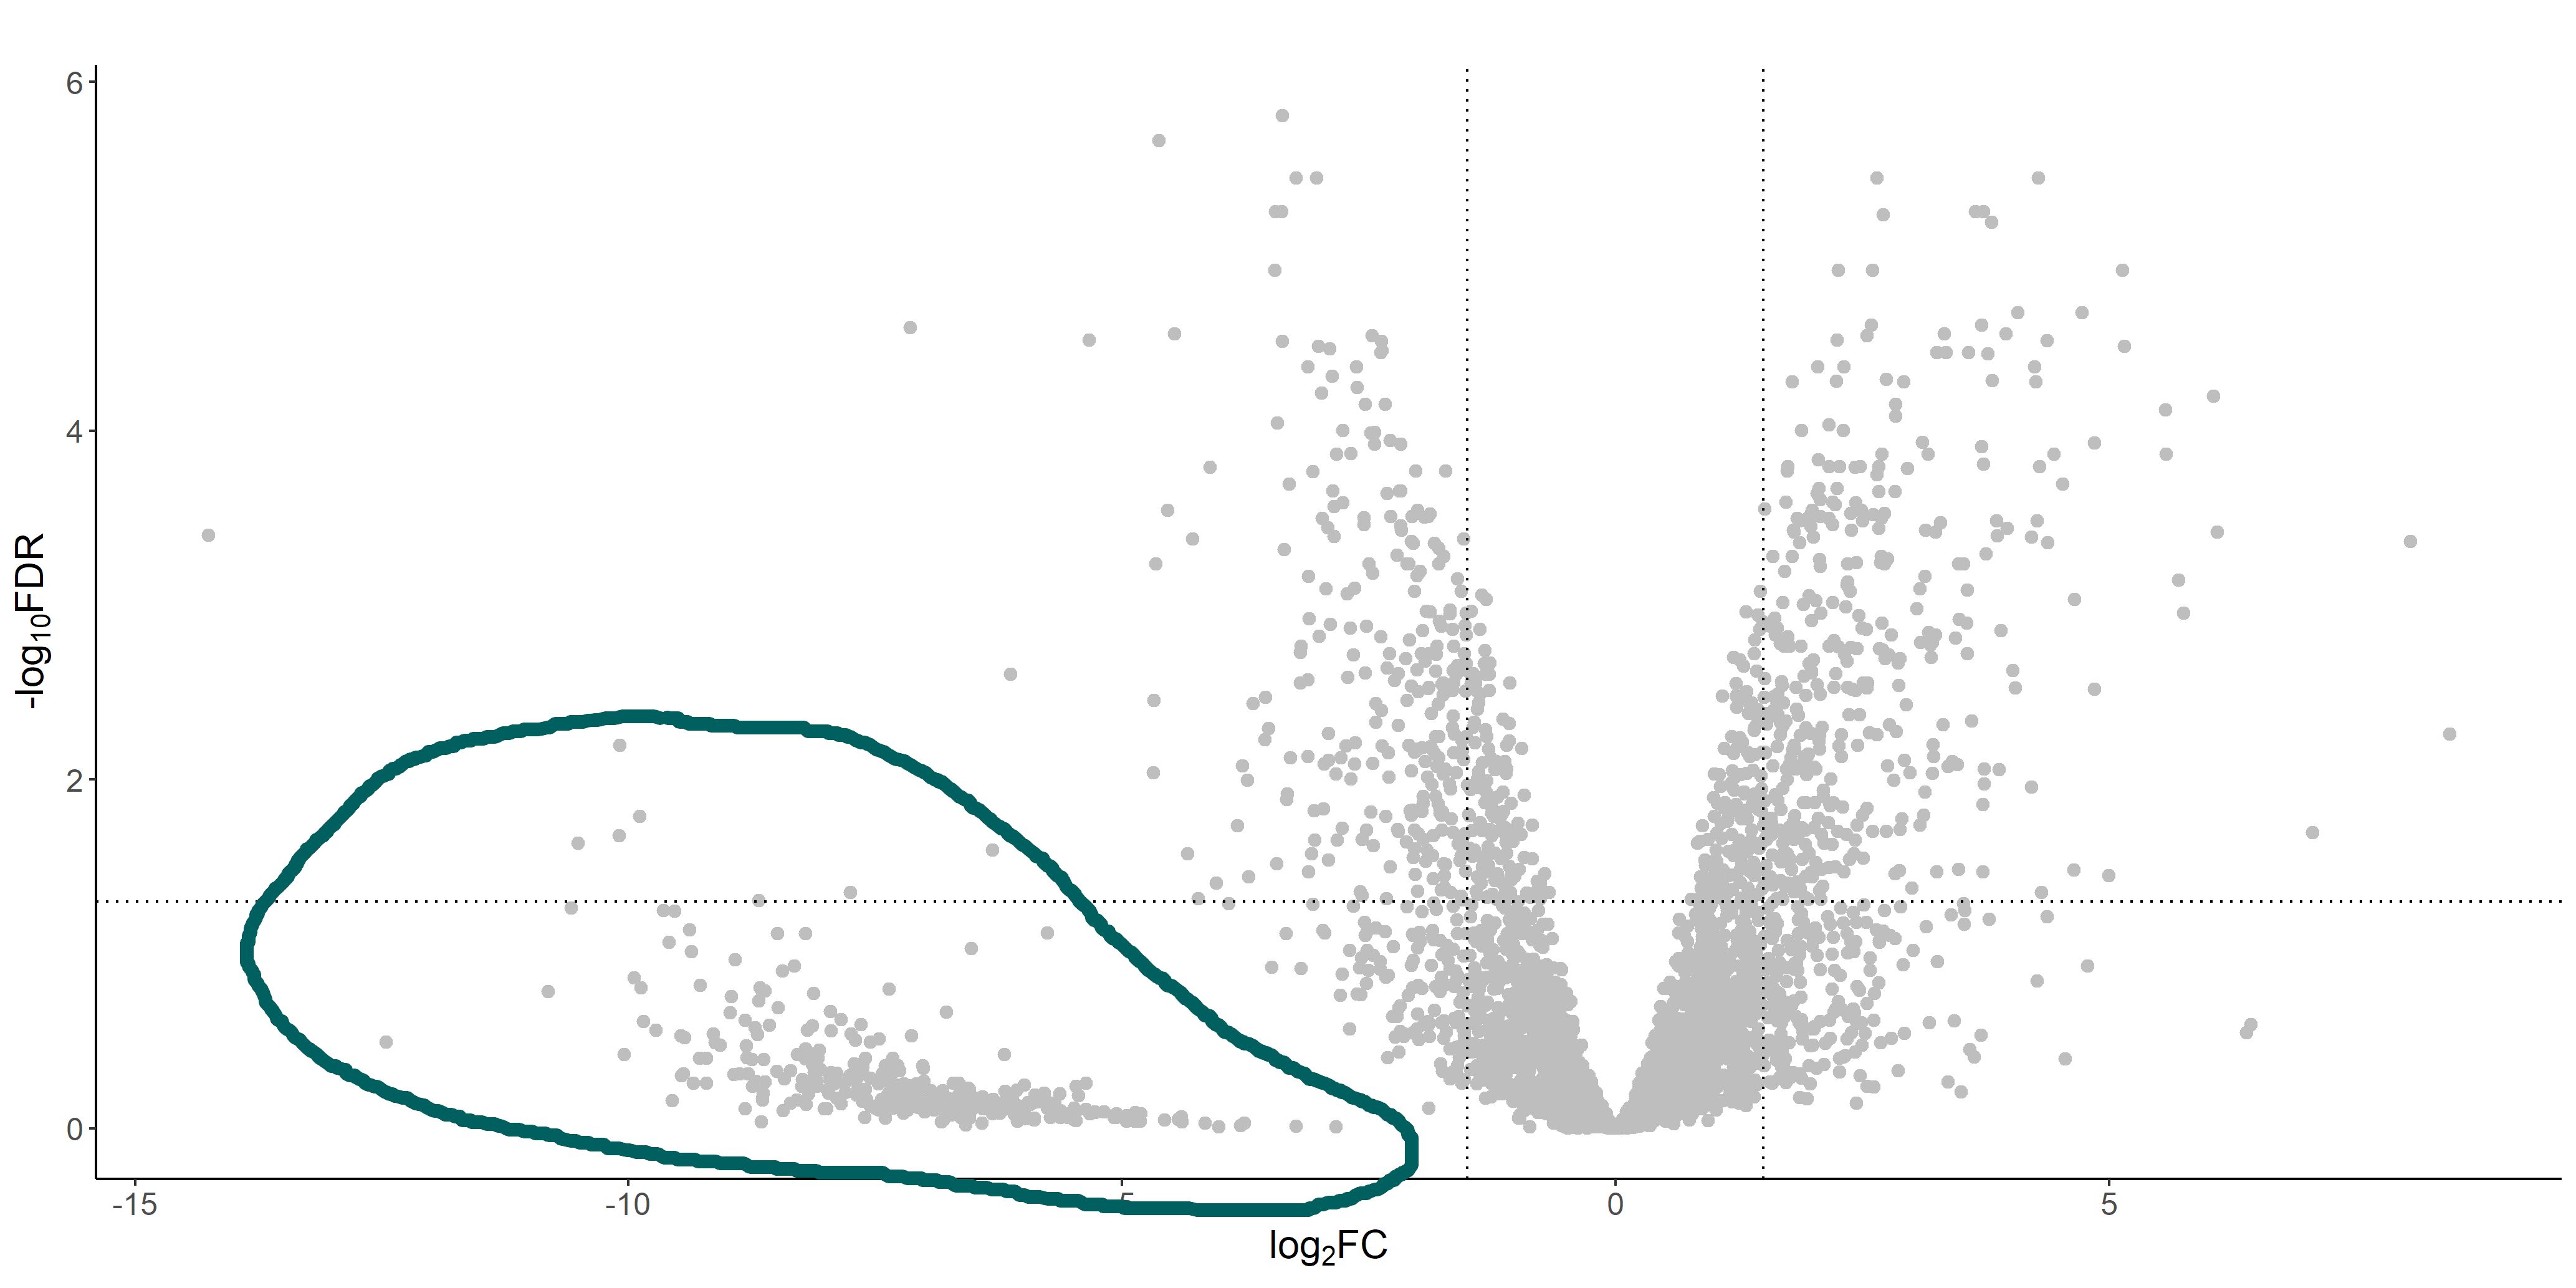
If we look at the volcano plot from the DGE analysis, there's a weird cluster of genes that are clearly separated from the "volcano":
These genes are the ones that have 0 (or very low) read counts in the treatment library (which has a much lower coverage than the control one). If we look at the raw and normalized counts of these genes, I see that often they have originally 0 reads, but after normalization they get assigned with a discrete number of reads. This number is usually relatively different between replicates, and I guess that's why edgeR (correctly I guess) assigns a high FDR to these genes.
I am however a bit confused by how can a gene with 0 reads be assigned any number of reads after normalization. Is this something that is expected? I don't recall ever seeing a volcano plot with a separated cluster of genes as I am seeing now.


This is very clear and it definitely helps. Thanks for taking the time to reply!