Hi
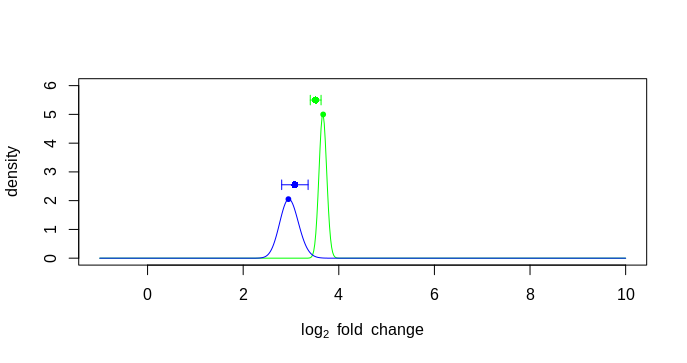
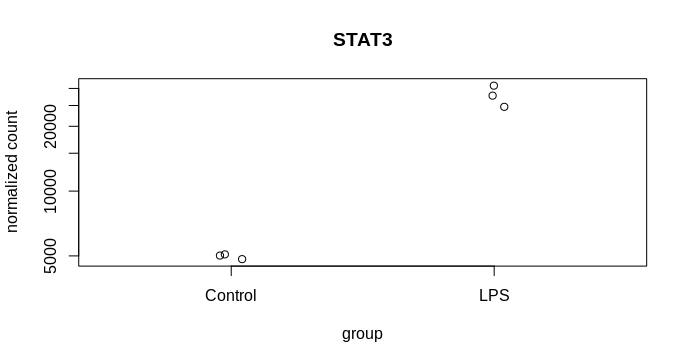
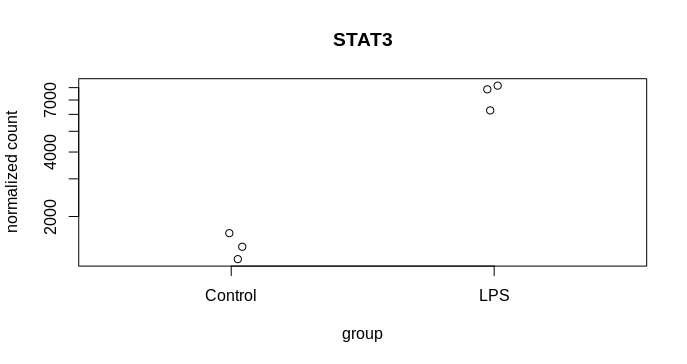
I am trying to visualise the spread of the mean count from MLE calculation following DEseq2, 2014 paper and the attached codes from DEseq2paper package. The difference in my case is, instead of two different genes, I am plotting the likelihood data of the same gene from two dataset. The experiment design is as follows, I have three reps of control and three reps of treatment samples. From the same samples two types of library was prepared mRNA (NEB for illumina) and lexogen quantseq (3 prime end). The idea is to compare the efficiency of two library preparation method to detect DGEs. The quantseq yielded 60% of the DGEs detected by NEB mRNA. Now I am exploring more to check the propertied of the genes that are not called DGEs by quantseq.So, many of them were low counts. That is one reason, another reason could be high dispersion. To visualise the disperson and compare the MLE from both method I am plotting gene by gene.
The issue I am having is the lfc from the result table and the mle from plot has difference more than 0.01 and there I am getting an error. Please see the code below. So, I am plotting the error bar position using the beta beta value corresponding to maximum MLE value. But why they are so much offset?
Thanks for any help.
betas <- seq(from=-1,to=10,length=500)
cond <- as.numeric(colData(dds.standard)$Treatment) - 1

likelihood <- function(k,alpha,intercept) {
  z <- sapply(betas,function(b) {
    prod(dnbinom(k,mu=sf*2^(intercept + b*cond),size=1/alpha))
  })
  z/sum(z * diff(betas[1:2]))
}

points2 <- function(x,y,col="black",lty) {
  points(x,y,col=col,lty=lty,type="l")
  points(x[which.max(y)],max(y),col=col,pch=20)
}

lfc1 <- res.standard["ICAM1",]$log2FoldChange
lfc2 <- res.three["ICAM1",]$log2FoldChange
lfc <- c(lfc1, lfc2)

k1 = counts(dds.standard)["ICAM1", ]
k2 = counts(dds.three)["ICAM1", ]
cond <- as.numeric(colData(dds)$Treatment) - 1
a1 = dispersions(dds.standard["ICAM1",])
a2 = dispersions(dds.three["ICAM1", ])
ints1 <- mcols(dds.standard["ICAM1",])$Intercept
ints2 <- mcols(dds.three["ICAM1",])$Intercept

lfcSE1 <- results(dds.standard["ICAM1",])$lfcSE
lfcSE2 <- results(dds.three["ICAM1",])$lfcSE
lfcSE <- c(lfcSE1, lfcSE2)

sf = sizeFactors(dds.standard)
density1 <- likelihood(k1,a1,ints1)
sf = sizeFactors(dds.three)
density2 <- likelihood(k2,a2,ints2)

position1 <- betas[which.max(density1)]
position2 <- betas[which.max(density2)]
position <- c(position1, position2)

hghts1 <- max(density1)+0.5
hghts2 <- max(density2)+0.5
hghts <- c(hghts1, hghts2)

mleFromPlot <- c(position1, position2)
stopifnot(all(abs(lfc - mleFromPlot) < .01)) #Error: all(abs(lfc - mleFromPlot) < 0.01) is not TRUE

plot(betas,likelihood(k1,.5,4),type="n",ylim=c(0,6),
     xlab=expression(log[2]~fold~change),
     ylab="density")
points2(betas,density1,lty=1,col="green")
points2(betas,density2,lty=1,col="blue")
points(position, hghts, col=c("green", "blue"), pch=16)
arrows(position, hghts, position + lfcSE, hghts, col=c("green", "blue"), length=.05, angle=90)
arrows(position, hghts, position - lfcSE, hghts, col=c("green", "blue"), length=.05, angle=90)
mtext(side=3,line=line,adj=adj,cex=cex)

> sessionInfo()
R version 3.6.1 (2019-07-05)
Platform: x86_64-pc-linux-gnu (64-bit)
Running under: Ubuntu 18.04.2 LTS

Matrix products: default
BLAS:   /usr/lib/x86_64-linux-gnu/blas/libblas.so.3.7.1
LAPACK: /usr/lib/x86_64-linux-gnu/lapack/liblapack.so.3.7.1

locale:
 [1] LC_CTYPE=en_GB.UTF-8       LC_NUMERIC=C               LC_TIME=en_GB.UTF-8
 [4] LC_COLLATE=en_GB.UTF-8     LC_MONETARY=en_GB.UTF-8    LC_MESSAGES=en_GB.UTF-8
 [7] LC_PAPER=en_GB.UTF-8       LC_NAME=C                  LC_ADDRESS=C
[10] LC_TELEPHONE=C             LC_MEASUREMENT=en_GB.UTF-8 LC_IDENTIFICATION=C

attached base packages:
[1] parallel  stats4    stats     graphics  grDevices utils     datasets  methods   base

other attached packages:
 [1] ggplot2_3.1.1               DESeq2_1.24.0               SummarizedExperiment_1.14.0
 [4] DelayedArray_0.10.0         BiocParallel_1.18.0         matrixStats_0.54.0
 [7] Biobase_2.44.0              GenomicRanges_1.36.0        GenomeInfoDb_1.20.0
[10] IRanges_2.18.0              S4Vectors_0.22.0            BiocGenerics_0.30.0

loaded via a namespace (and not attached):
 [1] bit64_0.9-7            splines_3.6.1          Formula_1.2-3          assertthat_0.2.1
 [5] latticeExtra_0.6-28    blob_1.1.1             GenomeInfoDbData_1.2.1 pillar_1.4.0
 [9] RSQLite_2.1.1          backports_1.1.4        lattice_0.20-38        glue_1.3.1
[13] digest_0.6.18          RColorBrewer_1.1-2     XVector_0.24.0         checkmate_1.9.3
[17] colorspace_1.4-1       htmltools_0.3.6        Matrix_1.2-17          plyr_1.8.4
[21] XML_3.98-1.19          pkgconfig_2.0.2        genefilter_1.66.0      zlibbioc_1.30.0
[25] purrr_0.3.2            xtable_1.8-4           scales_1.0.0           htmlTable_1.13.1
[29] tibble_2.1.1           annotate_1.62.0        withr_2.1.2            nnet_7.3-12
[33] lazyeval_0.2.2         survival_2.44-1.1      magrittr_1.5           crayon_1.3.4
[37] memoise_1.1.0          foreign_0.8-71         tools_3.6.1            data.table_1.12.2
[41] stringr_1.4.0          munsell_0.5.0          locfit_1.5-9.1         cluster_2.1.0
[45] AnnotationDbi_1.46.0   compiler_3.6.1         rlang_0.3.4            grid_3.6.1
[49] RCurl_1.95-4.12        rstudioapi_0.10        htmlwidgets_1.3        bitops_1.0-6
[53] base64enc_0.1-3        gtable_0.3.0           DBI_1.0.0              R6_2.4.0
[57] gridExtra_2.3          knitr_1.22             dplyr_0.8.0.1          bit_1.1-14
[61] Hmisc_4.2-0            stringi_1.4.3          Rcpp_1.0.1             geneplotter_1.62.0
[65] rpart_4.1-15           acepack_1.4.1          tidyselect_0.2.5       xfun_0.6
plotting error bar using betas
plotting error bar using lfc


