Visualisation of ChIP-seq data in r - function errors in Gviz and biomaRt
1
0
Entering edit mode
H.Chloe • 0
@hchloe-21223
Last seen 5.4 years ago

Dear all, I am trying to visualize my chip-seq data in r.(visualizing peak and gene annotation in r) I followed the whole process according to "ChIP-seq analysis basics(Aleksandra P ekowska, Simon Anders)" and there were some problems using BiomartGeneRegionTrack function.

Here is the code I'm using.

library(BSgenome)
library(BSgenome.Dmelanogaster.UCSC.dm6)
library(cluster.datasets)
genome <- BSgenome.Dmelanogaster.UCSC.dm6
si = seqinfo(genome)
si[c("chr2L", "chr2R")]

I tried to visualize a region on the D.melanogaster chromosome(genome dm6) so I changed some code for my data.

library(ShortRead)
library(Gviz)
library(xfun) # have some problems 
library(biomaRt) 
mart = useMart(biomart = "ENSEMBL_MART_ENSEMBL",
           dataset = "dmelanogaster_gene_ensembl",
           host = "www.ensembl.org") # I didn't include this in 'bm' - I am not sure I can use this ensembl for UCSC genome
fm = Gviz:::.getBMFeatureMap()
fm["symbol"] = "external_gene_id"

bm = BiomartGeneRegionTrack(chromosome = "chr2L", genome = "BDGP6.22",
                       start = 1009600, end = 1016000,
                       filter = list("with_ox_refseq_mrna"=T), 
                       size = 4, name = "RefSeq", utr5 = "red3", utr3 = "red3",
                       protein_coding = "black", col.line = NULL, cex = 7, 
                       featureMap = fm)

Error in .genome2Dataset(genome) : 
Unable to automatically determine Biomart data set for UCSC genome identifier 'BDGP6.22'.
Please manually provide biomaRt object

This "BiomartGeneRegionTrack" has some problems, but I don't know why. If anyone knows how to solve this problem, please help me.

Thanks in advance!

r • 1.0k views
ADD COMMENT
0
Entering edit mode
bernatgel ▴ 150
@bernatgel-7226
Last seen 10 months ago
Spain

Hi @H. Chloe,

I don't know why your code does not work, but since no one has given you an answer yet I'll suggest you an alternative to Gviz and Biomart. To plot this you can use karyoploteR instead of Gviz and the bioconductor annotation packages TxDb.Dmelanogaster.UCSC.dm6.ensGene and org.Dm.eg.db instead of Biomart.

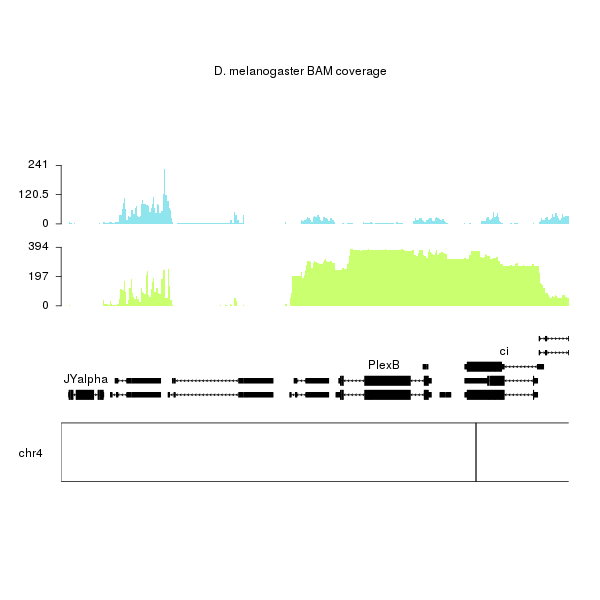
I'm assuming you have the ChIP seq data in BAM files and using the BAM files in the pasilla package as an example. To use your own BAM files you should change from untreated1_chr4() and untreated3_chr4() to the path to your bam files. With this code:

library(pasillaBamSubset)
library(karyoploteR)
library(TxDb.Dmelanogaster.UCSC.dm6.ensGene)
library(org.Dm.eg.db)


kp <- plotKaryotype(genome="dm6", zoom="chr4:1-60000", main="D. melanogaster BAM coverage")

genes.data <- makeGenesDataFromTxDb(karyoplot = kp, txdb = TxDb.Dmelanogaster.UCSC.dm6.ensGene)
#This line will only work with karyoploteR 1.10.4 or above
genes.data <- addGeneNames(genes.data, orgDb = org.Dm.eg.db, keytype = "ENSEMBL")

kpPlotGenes(kp, genes.data, r0=0, r1=0.3)

kp <- kpPlotBAMCoverage(kp, untreated1_chr4(), r0=0.4, r1=0.65, col="darkolivegreen1")
kpAxis(kp, r0=0.4, r1=0.65, ymax=kp$latest.plot$computed.values$max.coverage)
kp <- kpPlotBAMCoverage(kp, untreated3_chr4(), r0=0.75, r1=1, col="cadetblue2")
kpAxis(kp, r0=0.75, r1=1, ymax=kp$latest.plot$computed.values$max.coverage)

You'd get an image like this

ChIP-seq data plot example created with karyoploteR in D. melanogaster

Take into account that you'll need at least version 1.10.4 of karyoploteR to run addGeneNames. It will be available at Bioconductor in a couple of days or right now on github.

You'll have more information on how to use the package at https://bernatgel.github.io/karyoploter_tutorial/ and you might find interesting the example on plotting ENCODE epigenetic data using karyoploteR since it shows how to plot data in BigWig files instead of BAM files.

ADD COMMENT

Login before adding your answer.

Traffic: 711 users visited in the last hour
Help About
FAQ
Access RSS
API
Stats

Use of this site constitutes acceptance of our User Agreement and Privacy Policy.

Powered by the version 2.3.6