Dear all,
Briefly, I’m developing a tool to perform network analysis on an interactome weighted by RNA-seq counts. Even if I also did a differential expression analysis to get the list of DE genes, my topic here is related to the generation of normalized/transformed counts in order to weight the nodes of the interactome. This weight will be then used to analyze the network.
I would like to have your opinion on the following workflow. Would you do it differently? Is the CQN normalization too much? Should I check other values, more than sd-mean and bias plots?
Workflow
- Input: time-course RNA-seq experiment of 50 samples with 25 time-points (2 replicates) from yeast.
- Objectives: normalize the counts in order to have comparable values within- and between-samples.
- Between-sample normalization: according to sequencing depth as in usual differential expression analysis workflow.
- Within-sample normalization: according to gene length and GC-content.
- Variance stabilization: as discussed in DESeq2 paper and vignette, I think it is also important in my case to stabilize the variance.
- Workflow:
- Get gene length and GC-content using EDASeq.
- Correct gene length and GC-content using CQN.
- Add normalization factors from CQN into DESeq2 object.
- Apply DESeq2 VST method (too many samples for rlog).
# get DESeq object
dds = DESeqDataSetFromMatrix(countData = counts,
                             data.frame(condition=group),
                             ~ condition)

# apply VST
vsd = vst( dds, blind=FALSE )

# compute CQN normalization
cqnNorm = cqn(counts = counts,
              x = features[,"gc.content"],
              lengths = features[,"length"])

# apply VST with CQN normalization factors
cqnNormFactors = exp( cqnNorm$glm.offset )
normalizationFactors( dds ) = cqnNormFactors
cqnNorm.vst = vst( dds, blind=FALSE )
Results
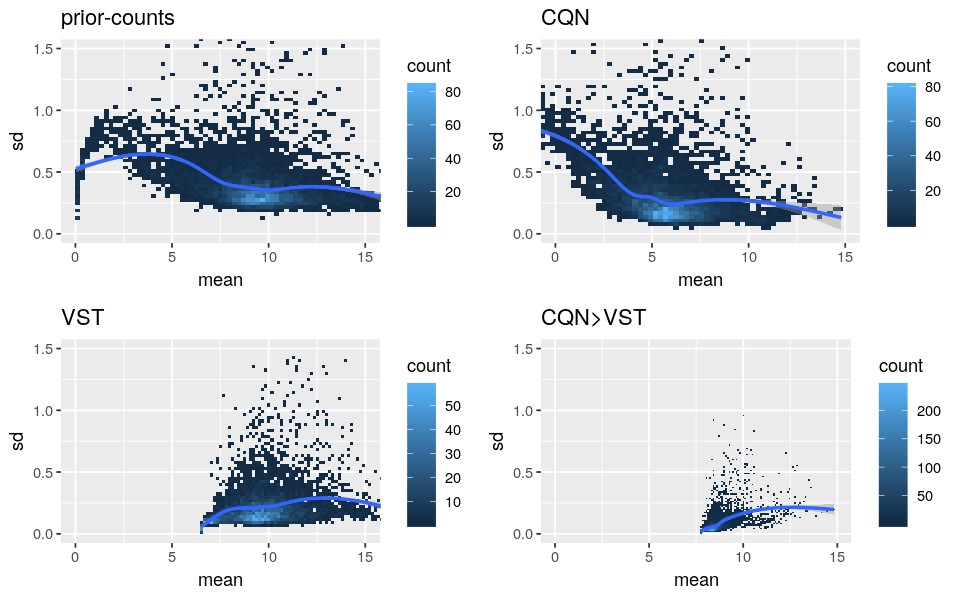
Please find below the standard deviation-mean plots of prior-counts (log2(counts+1)), log2-RPM from CQN, transformed data from VST and values from the above code (”CQN>VST”).
And here the gene length and GC-content biases from these methods.
Discussion
- As CQN cannot stabilize by itself the mean-variance dependency for low expressed genes and VST corrected lowly for the biases, it supports the use of both methods. But I’m worried that it is not too strong because the “CQN Norm>VST” curves are very flat.
- As reported by https://support.bioconductor.org/p/95683/, I also observed the GC-content bias was not corrected when dividing by the row geometric means as suggested by DESeq2 vignette.
- I also tried EDAseq. The paper claimed that it was not needed to correct by the length after GC-content normalization. But when I corrected by only one feature (GC-content or length), there was no effect on the other. So, as advised by the authors, I used CQN to take both features into account.
Please let me know if you read some papers with a similar goal.
A synthetic sessionInfo():
R version 3.5.1 (2018-07-02)
Platform: x86_64-conda_cos6-linux-gnu (64-bit)
Running under: Debian GNU/Linux 9 (stretch)

cqn_1.30.0
DESeq2_1.22.1
edgeR_3.24.1
EDASeq_2.16.0
Thanks a lot.
Michaël


